Deere & Company (DE), commonly known by its John Deere brand, is a global leader in agricultural, construction, and forestry machinery, as well as precision agriculture technologies and related financial services. The company’s green-and-yellow equipment, digital solutions, and connected machines help farmers and contractors improve productivity, sustainability, and profitability across fields, worksites, and forests. Deere now operates worldwide across North America, Europe, Latin America, and Asia-Pacific, serving over 100 countries.
Founded in 1837, the company is headquartered in Moline, Illinois, USA.
Deere Stock Underperforms
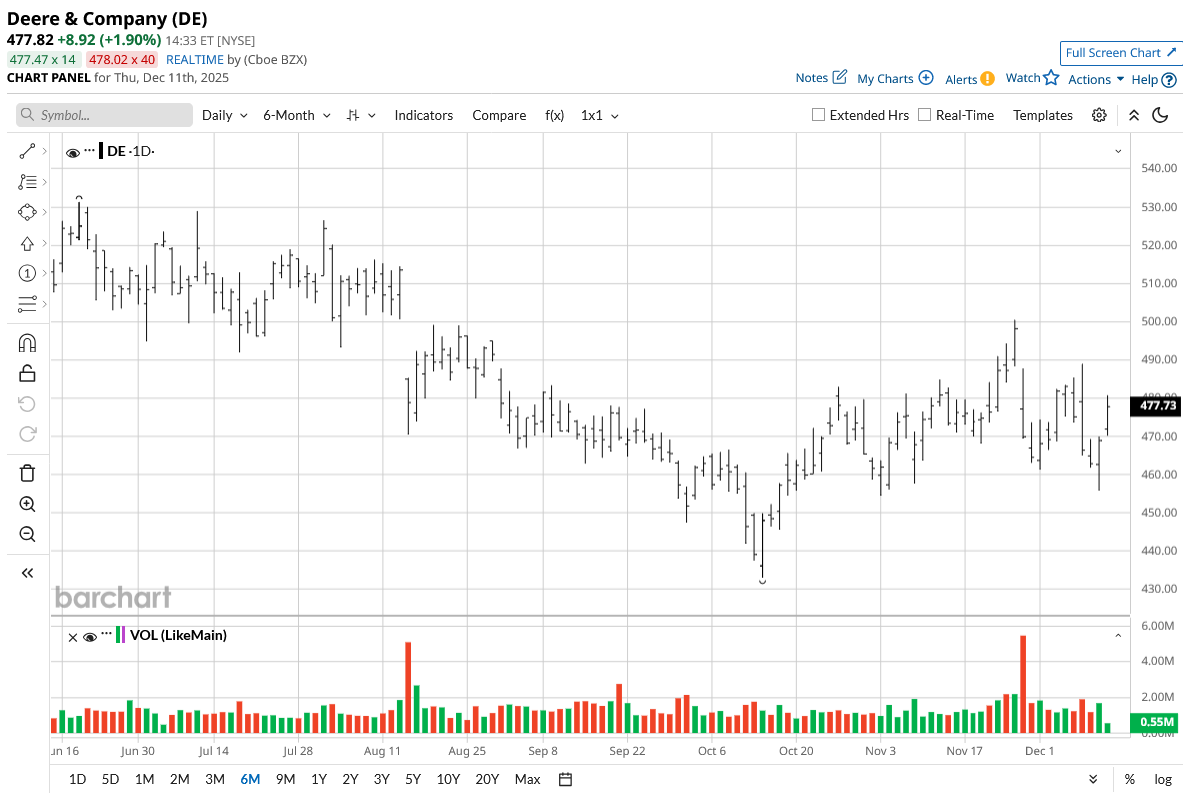
Deere & Company trades roughly 13% below its 52‑week high of $533.78, reflecting pressure after a weaker 2026 outlook. Over the past five days, the stock is down about 1% and roughly flat over one month. Three‑month returns are slightly positive, while the 6‑month move is down 8%. DE stock offers a dividend of about 1.38%, which came out to $1.62 for the past four quarters.
On a 52‑week basis, Deere is up about 7%, vastly underperforming the S&P 500 ($SPX), which gained roughly 13.3% over the same period.
Deere Slides on Results
Deere & Company reported fourth-quarter 2025 results on Nov. 26 with net sales and revenues of about $12.4 billion, up 11% year-over-year (YoY) and well ahead of analyst expectations of $9.8-9.9 billion. Diluted EPS came in at $3.93, modestly above the $3.85 consensus, but down around 14% from $4.55 a year earlier as margin pressure offset strong top-line growth. Net income attributable to Deere was roughly $1.07-$1.07 billion for the quarter.
Fourth-quarter equipment operations net sales rose 14% to about $10.6 billion, but profitability compressed across key segments. Production & Precision Agriculture sales increased 10% to $4.74 billion with a 12.7% operating margin, while Small Agriculture & Turf sales rose 7% to $2.46 billion, but operating profit fell to just $25 million. Construction & Forestry stood out with 27% sales growth to $3.38 billion and a 10.3% operating margin.
Despite higher revenue, overall net income declined as weaker large-ag margins, input cost inflation, and tariffs weighed on results. Deere still generated solid cash flow and finished FY2025 with about $5 billion in full-year net income, but investors focused on the deterioration in profitability, leading to a 5% slip on the day of results.
For FY2026, Deere guided net income to a range of $4.0 and $4.75 billion, below FY2025’s $5.03 billion and roughly 15-20% under prior Street expectations, signaling 2026 as a likely low point in the large agriculture cycle. Management expects continued pressure in high‑horsepower tractors and combines, partially offset by more resilient demand in small ag, turf, and construction, and plans to counter roughly $1.2 billion of tariff headwinds through productivity gains, supply chain adjustments, and selective price increases.
ETFs Exposed to Deere Amid Trump Comments
President Donald Trump stated on Monday that farm equipment prices have risen too high, urging manufacturers like Deere & Company to lower them. DE stock declined about 2% that day amid the comments. In response, Seeking Alpha's Quant Rankings highlight top ETFs with Deere exposure, spanning industrial, agricultural, manufacturing, and tech sectors, with assets from $1.59M to $24.84B.
Leading the pack are ARK Autonomous Technology & Robotics ETF (ARKQ) at 4.42 (Buy) and ARK Space & Defense Innovation ETF (ARKX.LN) at 4.40 (Buy), followed by VanEck Natural Resources ETF (HAP) with 3.83 (Buy) and Fidelity Disruptive Automation ETF (FBOT) at 3.65 (Buy). Hold-rated funds include Strive Natural Resources and Security ETF (FTWO, 3.39), iShares U.S. Manufacturing ETF (MADE) at 3.38, State Street Industrial Select Sector SPDR ETF (XLI, 3.19), and Fidelity MSCI Industrials Index ETF (FIDU) at 3.19.
Agriculture-focused ETFs lag, with VanEck Agribusiness ETF (MOO) at 1.47 (Strong Sell), First Trust Indxx Global Agriculture ETF (FTAG) at 1.43 (Strong Sell), and iShares MSCI Agriculture Producers ETF (VEGI) at 1.37 (Strong Sell). Other agribusiness ETFs include (DBA), (FAAR), (WEAT), (SOYB), (CORN), (TAGS), (TILL), and (KROP). Investors may favor tech-leaning funds over pure ag plays amid pricing pressures.
Should You Buy DE Stock?
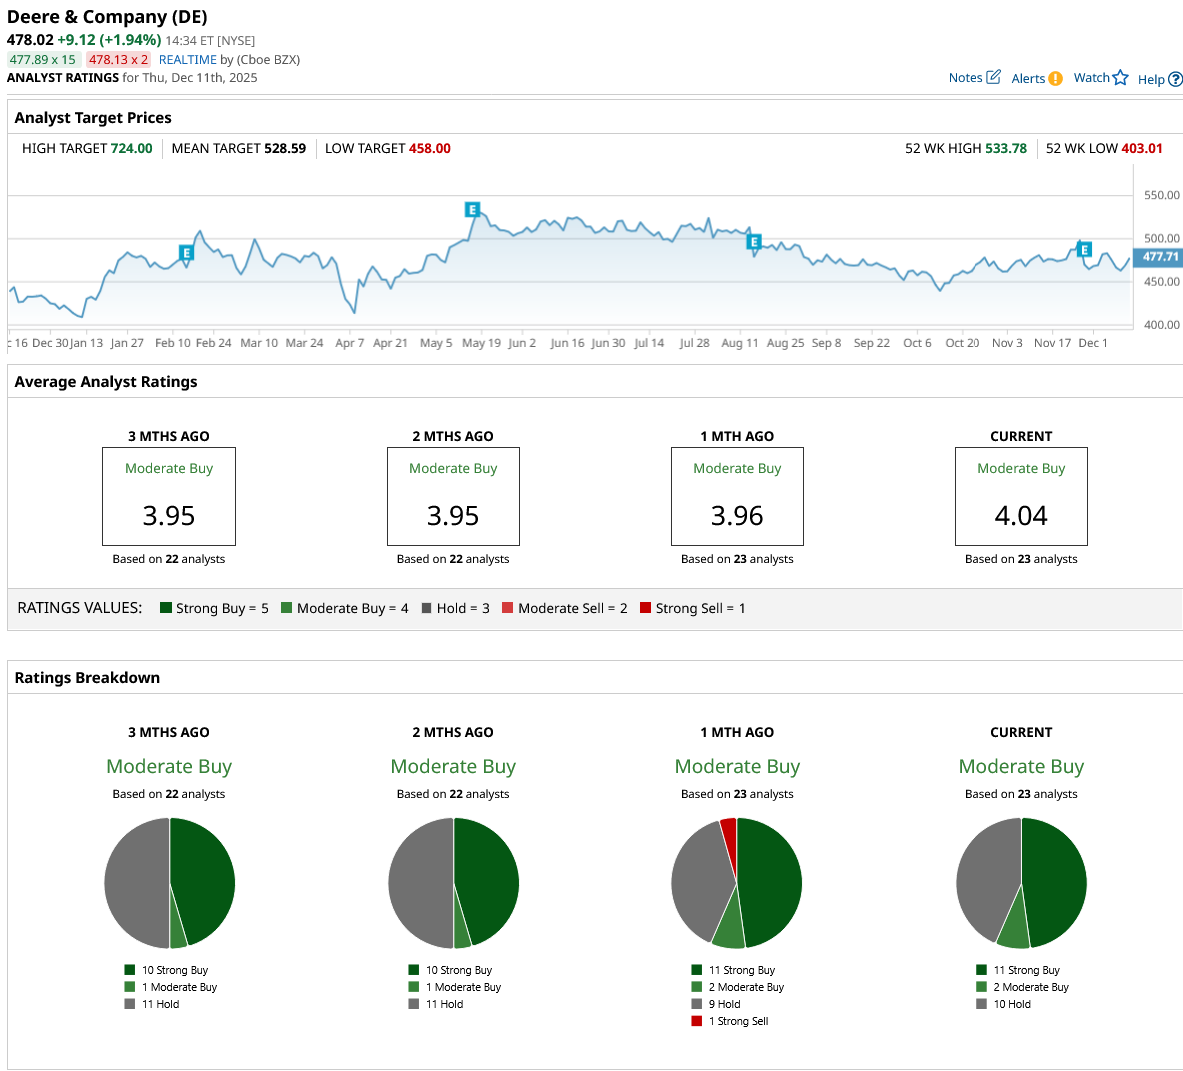
Despite the recent comments, Deere and Company has plenty of support on Wall Street with a consensus “Moderate Buy” rating and a mean price target of $524.27, reflecting an upside potential of 10% from the market rate.
The stock is covered by 23 analysts, receiving 11 “Strong Buy” ratings, two “Moderate Buy” ratings, and 10 “Hold” ratings.
On the date of publication, Ruchi Gupta did not have (either directly or indirectly) positions in any of the securities mentioned in this article. All information and data in this article is solely for informational purposes. For more information please view the Barchart Disclosure Policy here.
More news from Barchart


