ETFOptimize | High-performance ETF-based Investment Strategies

Quantitative strategies, Wall Street-caliber research, and insightful market analysis since 1998.


ETFOptimize | HOME
Close Window

How Is Everest Group's Stock Performance Compared to Other Insurance Stocks?

Hamilton, Bermuda-based Everest Group, Ltd. (EG), through its subsidiaries, provides reinsurance and insurance products in the United States, Europe, and internationally. With a market cap of $13.2 billion, Everest operates through the Insurance and Reinsurance segments.

Companies worth $10 billion or more are generally described as “large-cap stocks.” Everest Group fits right into that category, with its market cap exceeding this threshold, reflecting its substantial size and influence in the insurance industry.


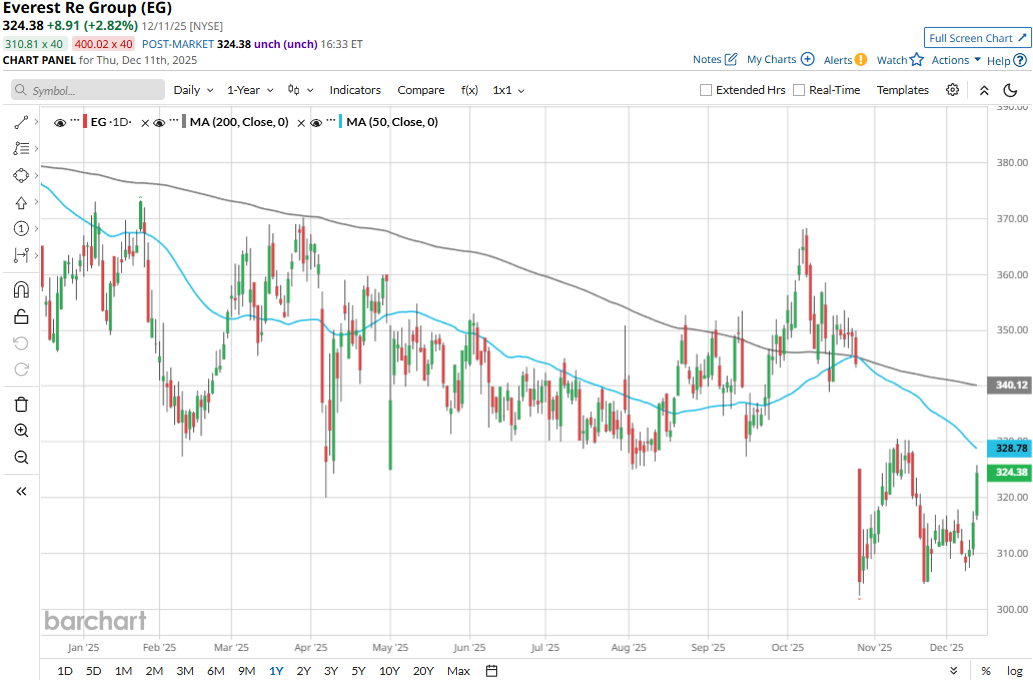
Despite its notable strengths, EG stock prices have declined 13.1% from its 52-week high of $373.23 touched on Jan. 27. Meanwhile, EG stock prices have dropped 6.9% over the past three months, significantly underperforming the iShares U.S. Insurance ETF’s (IAK1.4% uptick during the same time frame.

www.barchart.com

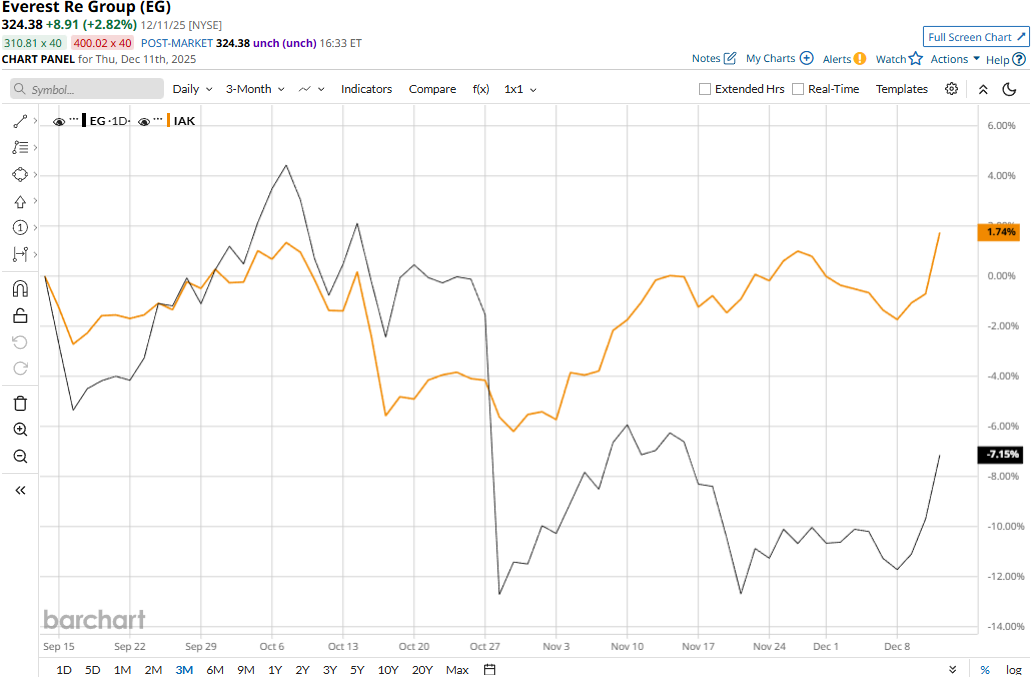
Everest’s performance has remained grim over the longer term as well. EG stock prices have declined 10.5% on a YTD basis and over the past year, underperforming IAK’s 7.5% gains in 2025 and 5.3% returns over the past 52 weeks.

EG stock has traded mostly below its 200-day moving average with some fluctuations and along its downward-sloping 50-day moving average over the past year, underscoring its bearish trend.

www.barchart.com

Everest Group’s stock prices tanked 11.4% in a single trading session following the release of its disappointing Q3 results on Oct. 27. Due to a drop in premiums earned and muted growth in net investment income, the company’s overall topline for the quarter inched up by a modest 79 bps year-over-year to $4.3 billion, missing the Street’s expectations by 2.9%.

Meanwhile, due to an increase in loss ratio, commission and brokerage ratio, and other underwriting expenses, the company’s combined ratio increased to 103.4%, reflecting high inefficiency in policy sales. This resulted in a 48.4% year-over-year decline in net operating income per share to $7.54, missing the consensus estimates by a staggering 43.7%.

Everest has also underperformed compared to its peer, Reinsurance Group of America, Incorporated’s (RGA5% decline in 2025 and 3.6% dip over the past 52 weeks.

Among the 18 analysts covering the EG stock, the consensus rating is a “Moderate Buy.” Its mean price target of $366.87 suggests a 13.1% upside potential from current price levels.


On the date of publication, Aditya Sarawgi did not have (either directly or indirectly) positions in any of the securities mentioned in this article. All information and data in this article is solely for informational purposes. For more information please view the Barchart Disclosure Policy here.


More news from Barchart

Recent Quotes

View More
Symbol Price Change (%)
AMZN  226.76
+5.49 (2.48%)
AAPL  272.19
+0.35 (0.13%)
AMD  200.98
+2.87 (1.45%)
BAC  54.26
-0.29 (-0.53%)
GOOG  303.75
+5.69 (1.91%)
META  664.45
+14.95 (2.30%)
MSFT  483.98
+7.86 (1.65%)
NVDA  174.14
+3.20 (1.87%)
ORCL  180.03
+1.57 (0.88%)
TSLA  483.37
+16.11 (3.45%)
Stock Quote API & Stock News API supplied by www.cloudquote.io
Quotes delayed at least 20 minutes.
By accessing this page, you agree to the Privacy Policy and Terms Of Service.


IntelligentValue Home
Close Window

DISCLAIMER

All content herein is issued solely for informational purposes and is not to be construed as an offer to sell or the solicitation of an offer to buy, nor should it be interpreted as a recommendation to buy, hold or sell (short or otherwise) any security.  All opinions, analyses, and information included herein are based on sources believed to be reliable, but no representation or warranty of any kind, expressed or implied, is made including but not limited to any representation or warranty concerning accuracy, completeness, correctness, timeliness or appropriateness. We undertake no obligation to update such opinions, analysis or information. You should independently verify all information contained on this website. Some information is based on analysis of past performance or hypothetical performance results, which have inherent limitations. We make no representation that any particular equity or strategy will or is likely to achieve profits or losses similar to those shown. Shareholders, employees, writers, contractors, and affiliates associated with ETFOptimize.com may have ownership positions in the securities that are mentioned. If you are not sure if ETFs, algorithmic investing, or a particular investment is right for you, you are urged to consult with a Registered Investment Advisor (RIA). Neither this website nor anyone associated with producing its content are Registered Investment Advisors, and no attempt is made herein to substitute for personalized, professional investment advice. Neither ETFOptimize.com, Global Alpha Investments, Inc., nor its employees, service providers, associates, or affiliates are responsible for any investment losses you may incur as a result of using the information provided herein. Remember that past investment returns may not be indicative of future returns.

Copyright © 1998-2017 ETFOptimize.com, a publication of Optimized Investments, Inc. All rights reserved.