VeriSign, Inc. (VRSN), headquartered in Reston, Virginia, provides domain name registry services and internet infrastructure that enable navigation of various recognized domain names. Valued at $22.5 billion by market cap, it is a critical infrastructure provider that operates and protects the authoritative domain name registries for .com and .net, making it central to global internet stability.
Companies worth $10 billion or more are generally described as “large-cap stocks,” and VRSN perfectly fits that description, with its market cap exceeding this mark, underscoring its size, influence, and dominance within the software infrastructure industry. The company generates highly recurring, high-margin revenue through domain registration and renewal fees, supported by long-term agreements with ICANN. Its business model is characterized by predictable cash flow, limited competitive exposure, and ongoing investment in cybersecurity and DNS resilience.
Despite being one of the most resilient names in internet infrastructure, VRSN shares slipped 21.4% from their 52-week high of $310.60, achieved on Jul. 28. Over the past three months, VRSN stock has dropped 15.6%, underperforming the SPDR S&P Software & Services ETF’s (XSW) marginal rise during the same time frame.
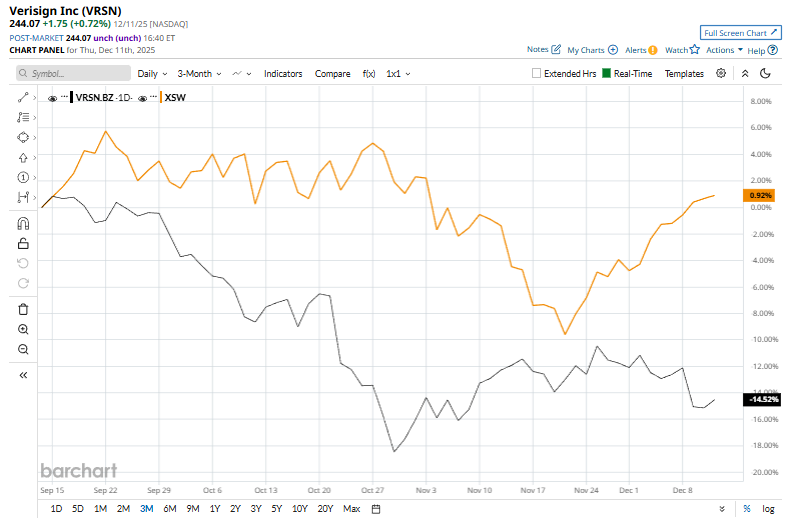
Yet the longer horizon tells a very different story. Year to date, VRSN is up 17.9%, and over the past 52 weeks it has gained 22%, outperforming XSW’s 3.6% YTD rise and its 2.3% decline over the same 12-month period.
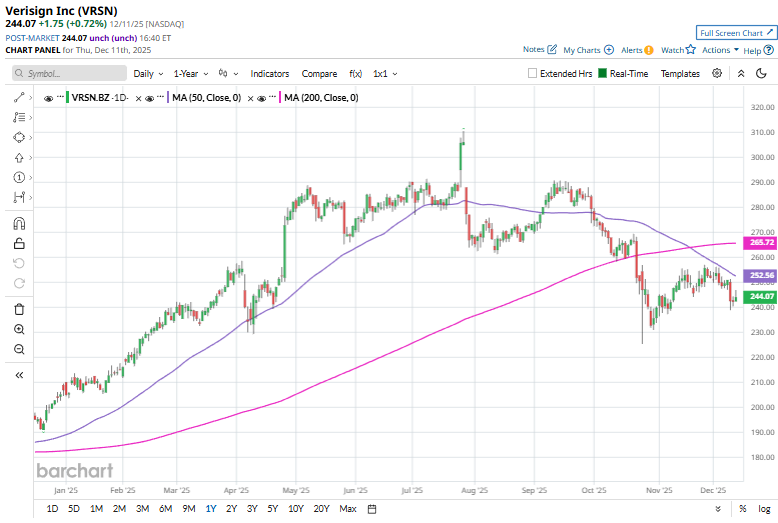
However, the stock has been trading under its 50-day and 200-day moving averages since October, reinforcing a downtrend.
VeriSign delivered a stronger-than-expected third quarter on October 23, posting 7.3% year-over-year revenue growth to $419.1 million, slightly above the Street’s $416.8 million estimate. The company closed the quarter with 171.9 million .com and .net domain registrations, a net addition of 1.45 million names. EPS came in at $2.27, up 9.7% from a year earlier and ahead of analysts’ $2.24 forecast. Deferred revenue reached $1.38 billion, an $80 million increase compared to the same-quarter last year, underscoring continued demand and strong renewal momentum.
In the competitive arena of software infrastructure, GoDaddy Inc. (GDDY) has lagged behind VRSN, falling 36.1% on a YTD basis and 39.5% over the past 52 weeks.
Wall Street analysts are fairly bullish on VRSN’s prospects. The stock has a consensus “Moderate Buy” rating from the four analysts covering it, and the mean price target of $310.67 suggests a potential upside of 27.3% from current price levels.
On the date of publication, Kritika Sarmah did not have (either directly or indirectly) positions in any of the securities mentioned in this article. All information and data in this article is solely for informational purposes. For more information please view the Barchart Disclosure Policy here.
More news from Barchart
- As Trump Takes a Stand Against Deere, How Should You Play the Blue-Chip Dividend Stock?
- Archer Aviation Is Bringing Its Flying Cars to Saudi Arabia. Is ACHR Stock a Buy Here?
- USA Rare Earth Just Revved up Its Commercial Timeline. Should You Buy USAR Stock Here?
- Robinhood Stock Gets Dragged Down by the Crypto Selloff. Should You Buy the Dip?


