Austin, Minnesota-based Hormel Foods Corporation (HRL) develops, processes, and distributes various meat, nuts, and other food products to foodservice, convenience store, and commercial customers. Valued at $13.1 billion by market cap, the company markets its products around the world under a variety of branded names like HORMEL, ALWAYS TENDER, APPLEGATE, AUSTIN BLUES, BLACK LABEL, BURKE, CAFÉ H, CHI-CHI'S, and more.
Companies worth $10 billion or more are typically classified as “large-cap stocks,” and HRL fits the label perfectly, with its market cap exceeding this threshold, underscoring its size, influence, and dominance within the packaged foods industry. HRL's strong brand portfolio drives its market presence and financial performance. The company's focus on operational excellence through its Transform and Modernize initiative has improved efficiencies, contributing to increased profitability and better positioning to navigate market fluctuations.
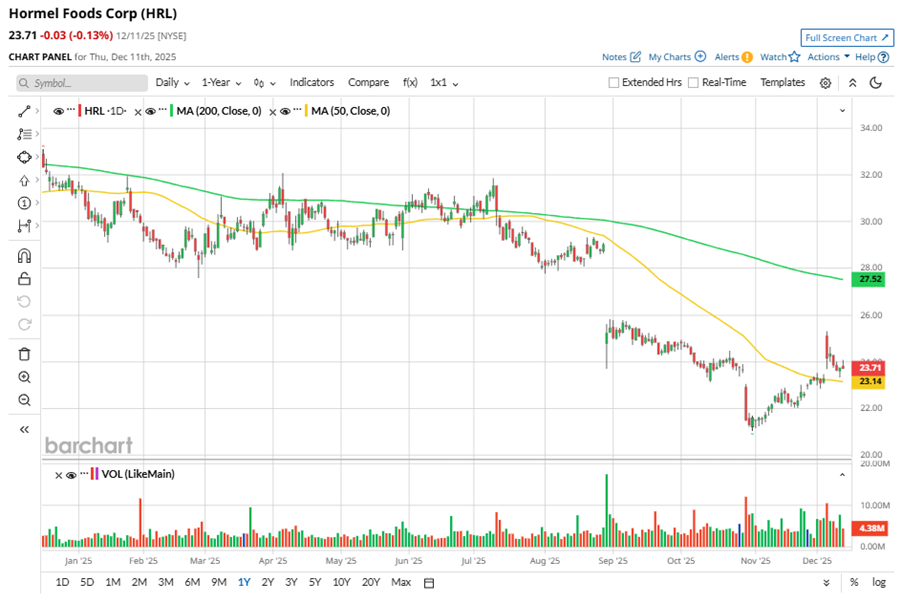
Despite its notable strength, HRL shares have slipped 29.9% from their 52-week high of $33.80, achieved on Dec. 11, 2024. Over the past three months, HRL stock has declined 6.7%, underperforming the S&P 500 Index’s ($SPX) 4.8% gains during the same time frame.

In the longer term, shares of HRL dipped 23.3% on a six-month basis and fell 28.4% over the past 52 weeks, underperforming SPX’s six-month gains of 14.6% and 13.4% returns over the last year.
To confirm the bearish trend, HRL has been trading below its 200-day moving average over the past year, with some fluctuations. However, the stock is trading above its 50-day moving average recently.
Hormel Foods' underperformance is due to input cost inflation, supply chain issues, and discrete events like a product recall and facility fire. Despite stability from brands like Jennie-O, margins and sales volumes were pressured. Looking ahead, Hormel expects continued volatility in input costs but is focused on cost savings, marketing support for core brands, and portfolio reshaping to drive growth.
On Dec. 4, HRL shares closed up by 3.8% after reporting its Q4 results. Its adjusted EPS of $0.32 exceeded Wall Street expectations of $0.30. The company’s revenue was $3.19 billion, falling short of Wall Street forecasts of $3.20 billion. HRL expects full-year adjusted EPS in the range of $1.43 to $1.51, and revenue in the range of $12.2 billion to $12.5 billion.
HRL’s rival, Conagra Brands, Inc. (CAG), has lagged behind the stock, with a 36.5% loss over the past 52 weeks, but has taken the lead over the stock with a 21.3% downtick on a six-month basis.
Wall Street analysts are cautious on HRL’s prospects. The stock has a consensus “Hold” rating from the 10 analysts covering it, and the mean price target of $27.14 suggests a potential upside of 14.5% from current price levels.
On the date of publication, Neha Panjwani did not have (either directly or indirectly) positions in any of the securities mentioned in this article. All information and data in this article is solely for informational purposes. For more information please view the Barchart Disclosure Policy here.
More news from Barchart
- Wall Street Is Souring on Netflix Stock Amid Warner Bros. Deal Drama. Is It Time to Ditch NFLX Now?
- Bob Iger Says ‘Creativity Is the New Productivity’ as Disney Bets $1 Billion on OpenAI and Entertainment Wars Heat Up
- This Little-Known Cloud Tech Stock Just Hit a New 52-Week High
- Can the Nasdaq Bull Keep Running? Here’s What Market Internals Are Telling Us Now.


