Texas-based Jacobs Solutions Inc. (J) provides professional services, including consulting, technical, scientific, and project delivery solutions. With a market cap of $16.1 billion, Jacobs operates across various sectors, delivering end-to-end services in advanced manufacturing, cities and places, energy, environmental, life sciences, transportation, and water.
Companies worth $10 billion or more are generally described as “large-cap stocks,” and Jacobs Solutions perfectly fits that description, with its market cap exceeding this mark, underscoring its size, influence, and dominance within the engineering & construction industry.
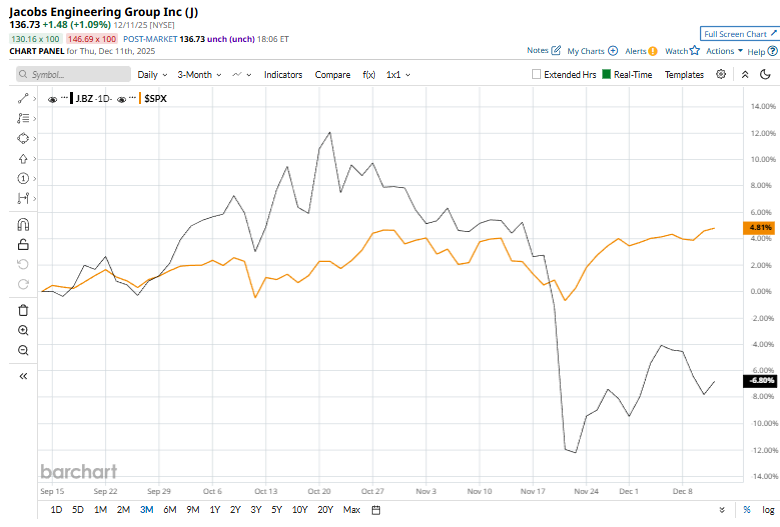
But its not all sunshine and rainbows for the Jacobs. J shares have fallen 18.8% from their 52-week high of $168.44, achieved on Oct. 24. Over the past three months, its shares have fallen 8.1%, trailing the S&P 500 Index ($SPX) 4.8% surge during the same time frame.
Shares of J have surged 2.3% on a YTD basis and 1.2% over the past 52 weeks, trailing SPX’s YTD gains of 17.3% and 13.4% returns over the last year.
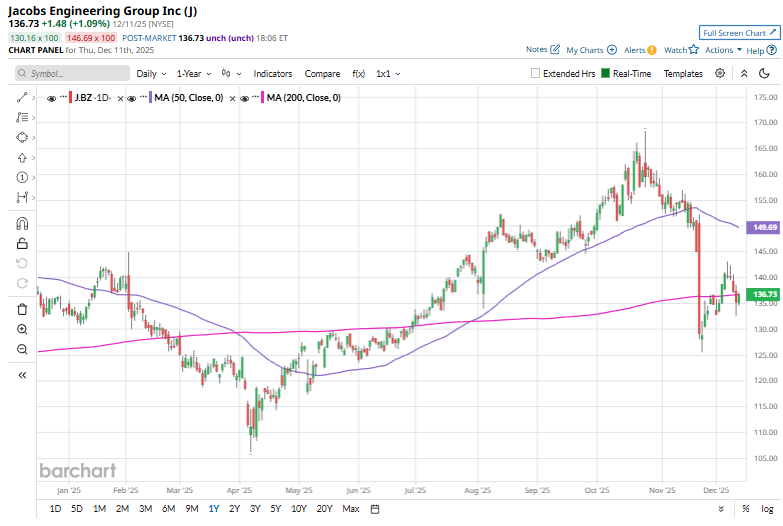
To confirm the bearish trend, J has been trading under its 50-day moving average since mid-November, and has dipped under its 200-day moving average recently.
Jacobs’ stock climbed 1.7% on November 26 after the company, through its joint venture with Arcadis, secured the role of Project Independent Certifier for Queensland’s Logan and Gold Coast Faster Rail Project. The JV will oversee quality and compliance for major upgrades that include doubling the rail corridor from two to four tracks, removing level crossings, and modernizing stations to boost safety, capacity, and passenger access between Brisbane and the Gold Coast.
Leadership from both firms emphasized that the partnership underscores their capability to deliver complex infrastructure and advance a more connected, resilient rail network ahead of Southeast Queensland’s growth and the 2032 Olympic and Paralympic Games.
Key rival, TopBuild Corp. (BLD), has taken the lead over J, showing resilience with a 42.6% return on a YTD basis and a 21.2% rise over the past year.
Wall Street analysts are moderately bullish on J’s prospects. The stock has a consensus “Moderate Buy” rating from the 16 analysts covering it, and the mean price target of $158.21 suggests a potential upside of 15.7% from current price levels
On the date of publication, Kritika Sarmah did not have (either directly or indirectly) positions in any of the securities mentioned in this article. All information and data in this article is solely for informational purposes. For more information please view the Barchart Disclosure Policy here.
More news from Barchart
- As Trump Takes a Stand Against Deere, How Should You Play the Blue-Chip Dividend Stock?
- Archer Aviation Is Bringing Its Flying Cars to Saudi Arabia. Is ACHR Stock a Buy Here?
- USA Rare Earth Just Revved up Its Commercial Timeline. Should You Buy USAR Stock Here?
- Robinhood Stock Gets Dragged Down by the Crypto Selloff. Should You Buy the Dip?