Houston, Texas-based NRG Energy, Inc. (NRG) operates as an energy and home services company. Valued at $32.7 billion by market cap, the company owns and operates a diverse portfolio of power-generating facilities. It offers energy production and cogeneration facilities, thermal energy production, and energy resource recovery facilities.
Companies worth $10 billion or more are generally described as “large-cap stocks,” and NRG perfectly fits that description, with its market cap exceeding this mark, underscoring its size, influence, and dominance within the utilities - independent power producers industry. NRG's strengths lie in its scale, diversification, and strategic positioning, enabling cost advantages and differentiation. The company benefits from economies of scale, a diversified generation portfolio, strong brand equity, financial resilience, and a disciplined capital allocation strategy. This positions NRG to adapt to changing market conditions, capitalize on growth opportunities, and drive operational excellence.
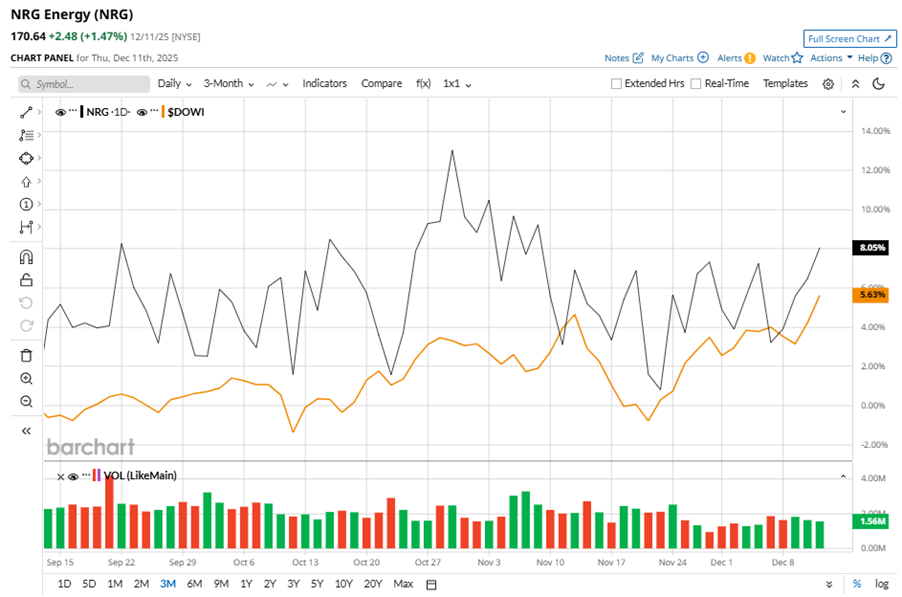
Despite its notable strength, NRG shares slipped 5.5% from their 52-week high of $180.54, achieved on Oct. 29. Over the past three months, NRG stock has gained 8.1%, outperforming the Dow Jones Industrials Average’s ($DOWI) 5.6% gains during the same time frame.
In the longer term, shares of NRG climbed 14.5% on a six-month basis and surged 78.7% over the past 52 weeks, outperforming DOWI’s six-month gains of 13.6% and 10.3% returns over the last year.
To confirm the bullish trend, NRG has been trading above its 50-day moving average since early September, with some fluctuations. The stock has been trading above its 200-day moving average over the past year, with slight fluctuations.

NRG’s acquisition of assets from LS Power will double its natural gas generation capacity, driving its performance.
On Nov. 6, NRG shares closed down by 1.8% after reporting its Q3 results. Its revenue stood at $7.6 billion, up 5.7% year over year. The company’s adjusted EPS came in at $2.78, up 32.4% year over year.
NRG’s rival, Vistra Corp. (VST), has lagged behind the stock with 4.7% gains on a six-month basis and a 19.6% uptick over the past 52 weeks.
Wall Street analysts are reasonably bullish on NRG’s prospects. The stock has a consensus “Moderate Buy” rating from the 13 analysts covering it, and the mean price target of $210.18 suggests a potential upside of 23.2% from current price levels.
On the date of publication, Neha Panjwani did not have (either directly or indirectly) positions in any of the securities mentioned in this article. All information and data in this article is solely for informational purposes. For more information please view the Barchart Disclosure Policy here.
More news from Barchart
- Wall Street Is Souring on Netflix Stock Amid Warner Bros. Deal Drama. Is It Time to Ditch NFLX Now?
- Bob Iger Says ‘Creativity Is the New Productivity’ as Disney Bets $1 Billion on OpenAI and Entertainment Wars Heat Up
- This Little-Known Cloud Tech Stock Just Hit a New 52-Week High
- Can the Nasdaq Bull Keep Running? Here’s What Market Internals Are Telling Us Now.


