Dallas, Texas-based Southwest Airlines Co. (LUV) is a passenger airline company that provides scheduled air transportation services. Valued at a market cap of $21.1 billion, the company is known for its point-to-point route network, customer-friendly policies, and strong focus on operational efficiency.
Companies valued at $10 billion or more are typically classified as “large-cap stocks,” and LUV fits the label perfectly, with its market cap exceeding this threshold, underscoring its size, influence, and dominance within the airline industry. The company is widely recognized for its low fares, no-change-fee policy, and high customer satisfaction. With an extensive network serving leisure and business travelers across the U.S. and select international destinations, it has built a reputation for reliability, cost discipline, and a distinctive employee-centric culture.
This airline company touched its 52-week high of $42 in the last trading session. Shares of LUV have soared 31.7% over the past three months, notably outperforming the State Street Industrial Select Sector SPDR ETF’s (XLI) 4.1% rise during the same time frame.
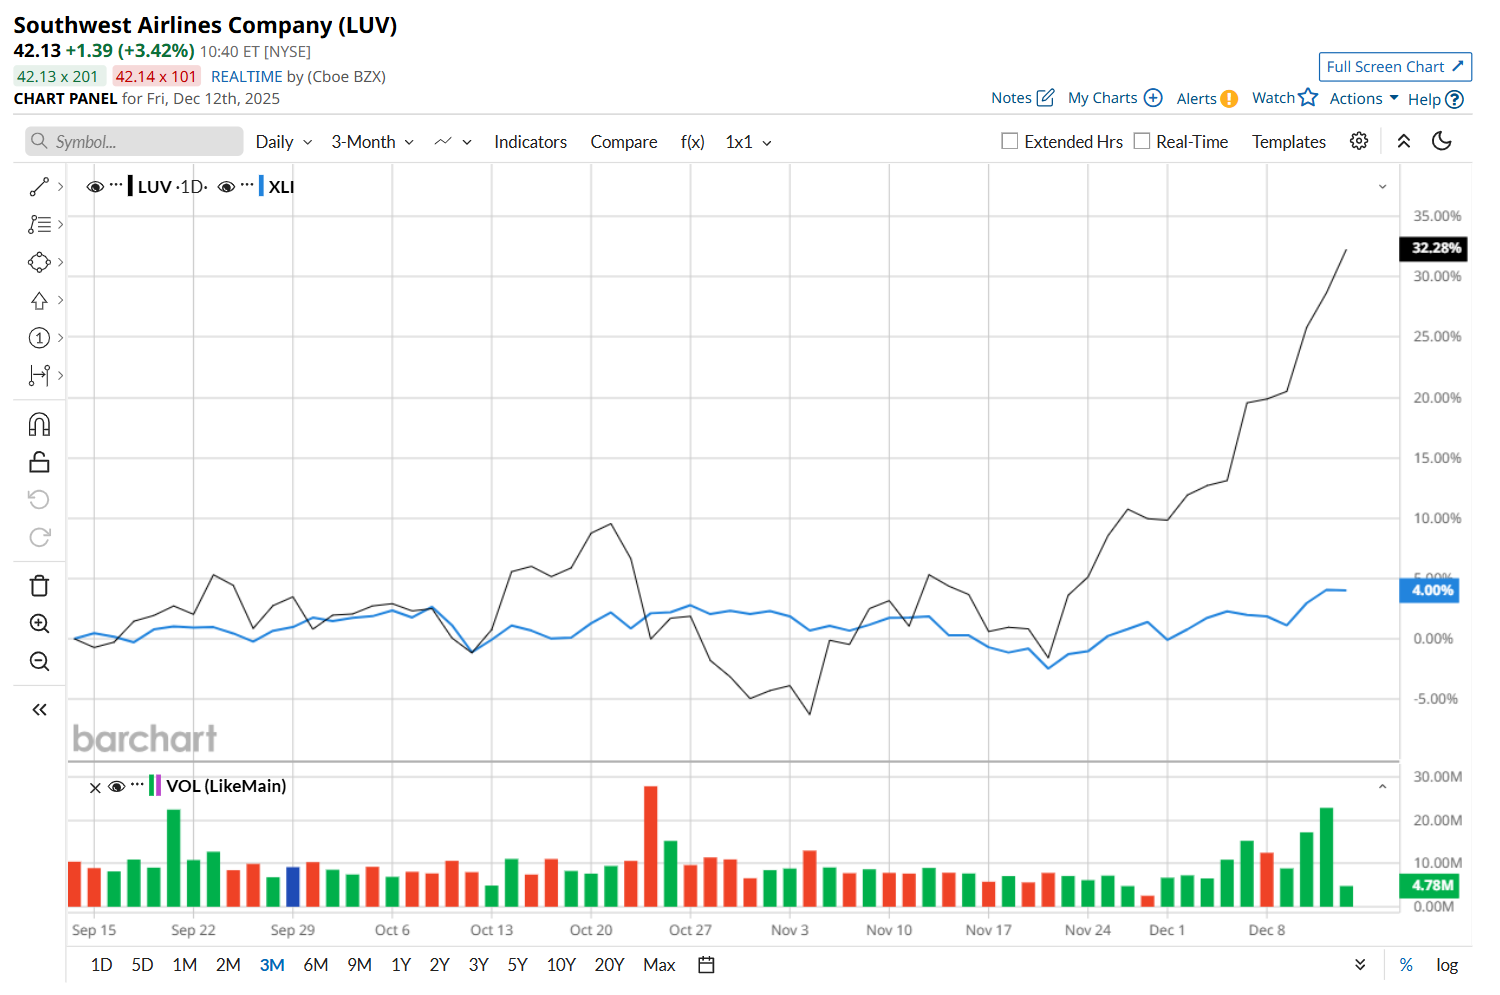
In the longer term, LUV has rallied 25.5% over the past 52 weeks, outpacing XLI’s 14.5% uptick over the same time frame. Moreover, on a YTD basis, shares of LUV are up 24%, compared to XLI’s 19.7% return.
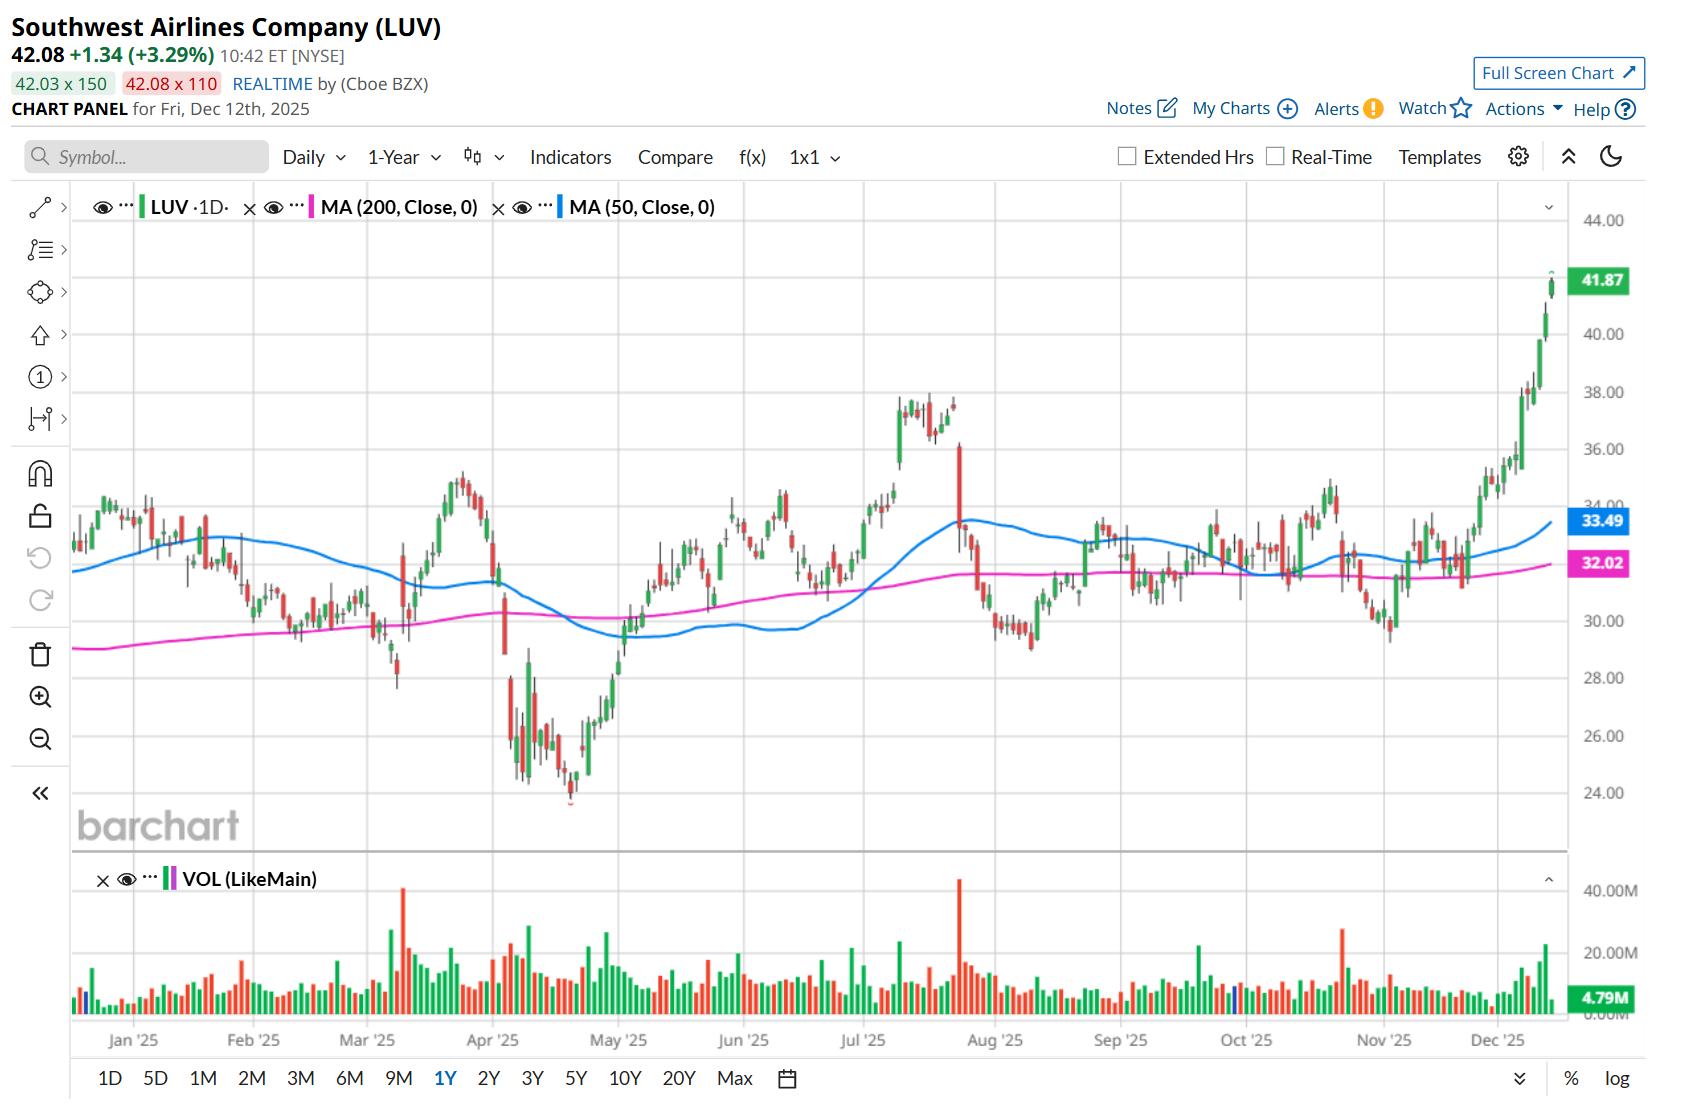
To confirm its bullish trend, LUV has been trading above its 200-day and 50-day moving averages since late November.
On Oct. 22, LUV reported mixed Q3 results, and its shares plunged 6.3% in the following trading session. The company's overall revenue increased 1.1% year-over-year to $6.9 billion, but missed consensus estimates by a slight margin, which might have weighed on investor sentiment. However, on the brighter side, its adjusted EPS of $0.11 handily surpassed Wall Street expectations of $0.01 and is expected to deliver meaningful margin expansion in the fourth quarter.
LUV’s outperformance looks even more pronounced when compared to its rival, JetBlue Airways Corporation (JBLU), which declined 30.6% over the past 52 weeks and 36.1% on a YTD basis.
Despite LUV’s recent outperformance, analysts remain cautious about its prospects. The stock has a consensus rating of "Hold” from the 22 analysts covering it. While the company is trading above its mean price target of $34.87, its Street-high price target of $48 suggests a 15.1% premium to its current price levels.
On the date of publication, Neharika Jain did not have (either directly or indirectly) positions in any of the securities mentioned in this article. All information and data in this article is solely for informational purposes. For more information please view the Barchart Disclosure Policy here.
More news from Barchart
- Gemini Space Station Is Launching a Prediction Markets Business. Should You Buy GEMI Stock Here?
- As Tesla Gets Ready to Remove Its Robotaxi Safety Drivers and Launch New FSD Model, Should You Buy TSLA Stock Here?
- Will Tesla Reclaim Its Top Growth Stock Crown in 2026?
- Forget Palantir, This ‘Strong Buy’ AI Stock Beats PLTR on Value


