Headquartered in Zurich, Switzerland, Amcor plc (AMCR) delivers packaging solutions for consumer and healthcare markets, emphasizing sustainability across flexible and rigid formats. With a market capitalization of nearly $19 billion, well above the $10 billion “large-cap” threshold, the company serves global food, beverage, medical, pharmaceutical, and personal care industries.
Despite this scale, AMCR stock is currently trading 21.2% below its March high of $10.45 and has slipped modestly over the past three months. Over the same period, the S&P 500 Index ($SPX) advanced 3.7%, highlighting clear relative underperformance.
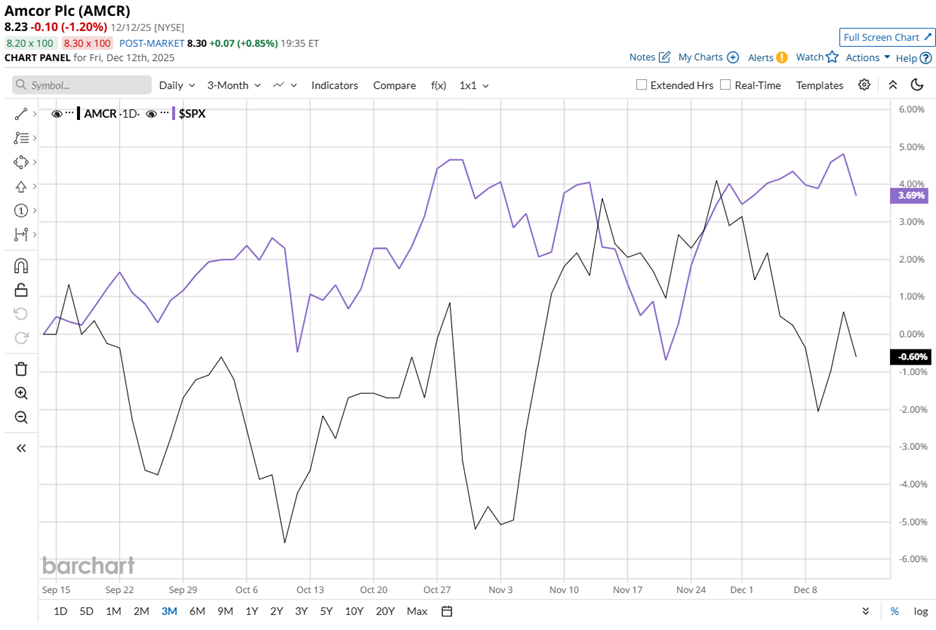
The relative weakness becomes more pronounced over longer horizons. AMCR declined 17.6% over the past 52 weeks and fell another 12.5% year-to-date (YTD). These losses stand in stark contrast to the S&P 500’s respective gains of 12.8% and 16.1%, underscoring sustained sentiment pressure.
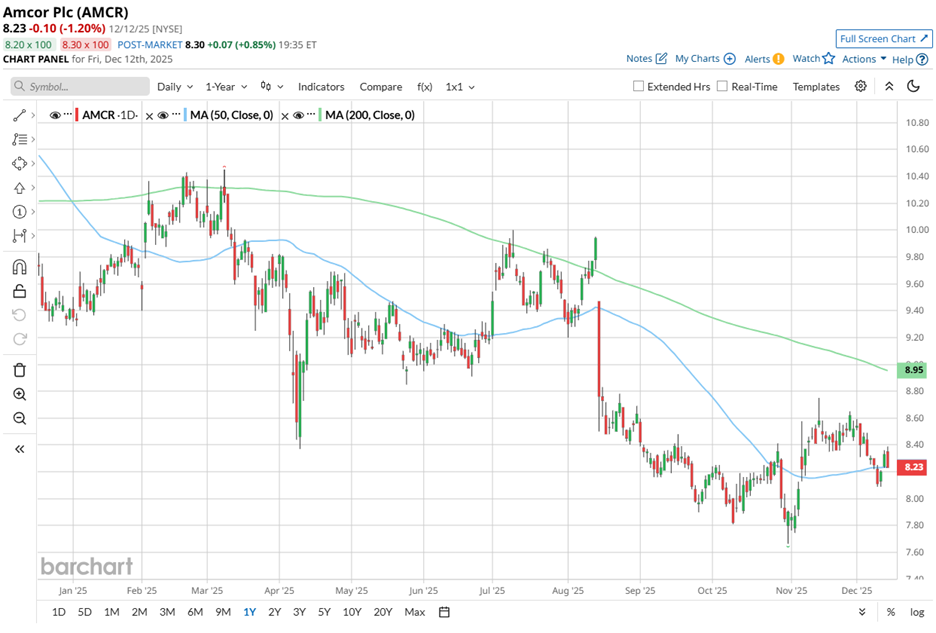
Technically, the price action reinforces that caution. The stock has remained below its 200-day moving average of $8.95 since mid-August, repeatedly failing at that declining trend line. Although AMCR stock briefly reclaimed its 50-day average of $8.23 in Nov, the pullback in Dec reversed that progress, leaving the near-term trend weak.
Fundamentals, however, have begun to stabilize expectations. On Nov 5, AMCR stock gained 2.5% after reporting Q1 fiscal 2026 results. Revenue rose 71.3% year over year to $5.75 billion, modestly missing the $5.83 billion analyst estimate, while adjusted EPS reached $0.19, essentially matching expectations and rising 18% annually.
More importantly, earnings exceeded the midpoint of management’s guidance range, highlighting disciplined cost control and improving productivity. The results also captured the Berry business integration, with synergies tracking at the upper end of expectations, strengthening confidence in management’s execution.
Looking ahead, management targets at least $260 million in synergy benefits in fiscal 2026. Over the three years through fiscal 2028, synergies alone could drive more than 30% EPS growth.
Industry comparisons add perspective, as pressure extends beyond Amcor. Shares of the company’s rival, Ball Corporation (BALL), also declined 12.2% over the past 52 weeks and fell another 7.7% YTD.
Despite the weak price action, analysts remain optimistic about the company's prospects. Among 16 analysts, AMCR holds a “Moderate Buy” consensus rating, and the average price target of $10.40 reflects potential upside of 26.4% from current levels.
On the date of publication, Aanchal Sugandh did not have (either directly or indirectly) positions in any of the securities mentioned in this article. All information and data in this article is solely for informational purposes. For more information please view the Barchart Disclosure Policy here.
More news from Barchart