Pittsburgh, Pennsylvania-based EQT Corporation (EQT) explores and produces natural gas, with a primary focus on the Appalachian Basin in Ohio, Pennsylvania, and West Virginia. Valued at $34.7 billion by market cap, EQT sells natural gas and natural gas liquids to marketers, utilities, and industrial customers through its pipelines.
Companies worth $10 billion or more are generally described as "large-cap stocks." EQT fits right into that category, with its market cap exceeding this threshold, reflecting its substantial size and influence in the energy sector. Alongside, the company also provides marketing services and contractual pipeline capacity management services.
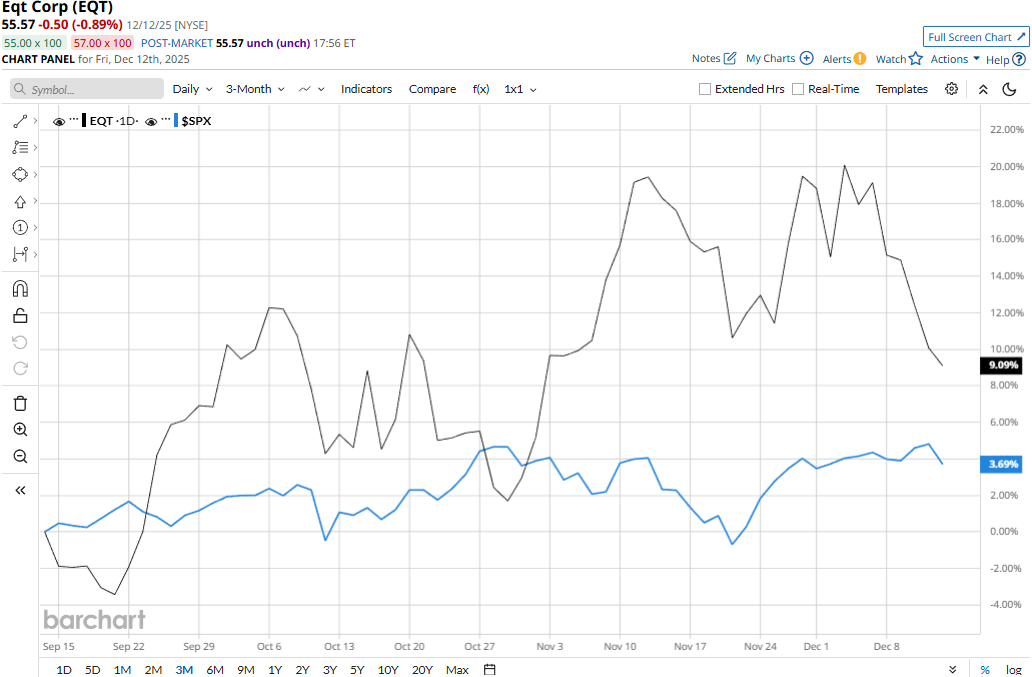
EQT touched its all-time high of $62.23 on Dec. 5 and is currently trading 10.7% below that peak. Meanwhile, EQT stock prices have gained 9.1% over the past three months, notably outperforming the S&P 500 Index’s ($SPX) 3.7% uptick during the same time frame.
EQT’s performance has remained impressive over the longer term as well. EQT stock prices have soared 20.5% on a YTD basis and 21.2% over the past 52 weeks, outpacing SPX’s 16.1% gains in 2025 and 12.8% returns over the past year.
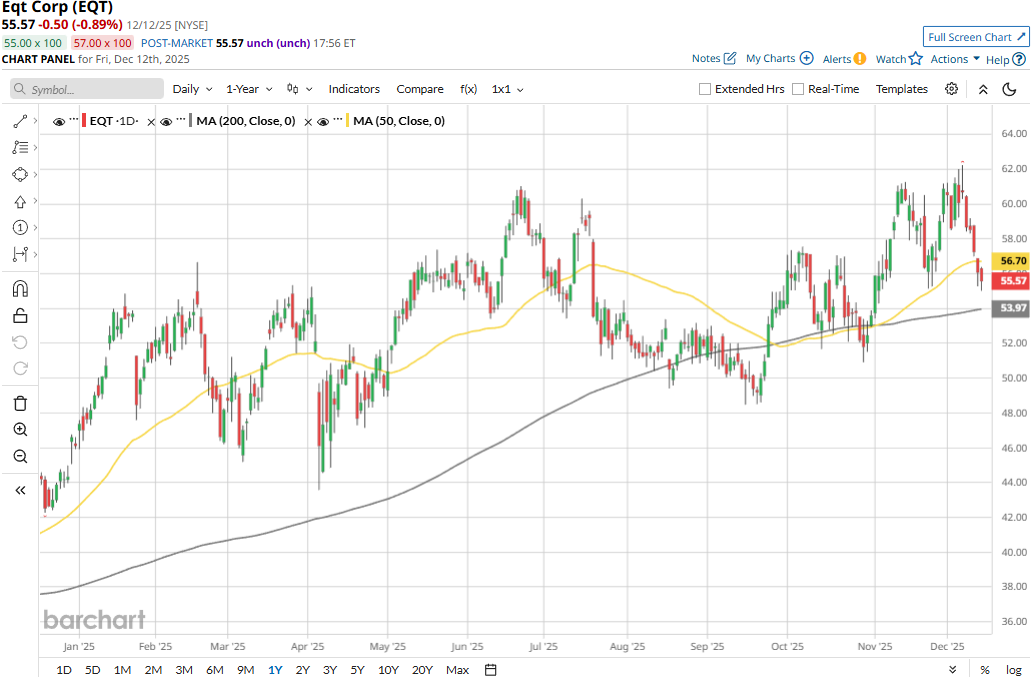
EQT stock has traded mostly above its 200-day moving average over the past year and mostly above its 50-day moving average since late September, with some fluctuations, underscoring its bullish trend.
Despite delivering better-than-expected results, EQT stock prices dropped nearly 4% in the trading session following the release of Q3 results on Oct. 21. During the quarter, the company’s sales volumes increased 9.1% year-over-year to 634.4 Bcfe, coming in at the high end of management’s guidance. Further, its average sales prices soared 39.7% year-over-year to $2.64 per Mcfe. Overall, the company’s topline soared 52.3% year-over-year to $1.96 billion, beating the consensus estimates by a notable margin. Meanwhile, its adjusted EPS skyrocketed 225% year-over-year to $0.52, surpassing the Street’s expectations by 10.6%. Following the initial dip, EQT stock prices remained in the green for three subsequent trading sessions.
Moreover, EQT has notably outperformed its peer, EOG Resources, Inc.’s (EOG) 11.9% decline on a YTD basis and 14.7% plunge over the past 52 weeks.
Among the 26 analysts covering the EQT stock, the consensus rating is a “Strong Buy.” As of writing, EQT’s mean price target of $65 suggests a 17% upside potential from current price levels.
On the date of publication, Aditya Sarawgi did not have (either directly or indirectly) positions in any of the securities mentioned in this article. All information and data in this article is solely for informational purposes. For more information please view the Barchart Disclosure Policy here.
More news from Barchart