Valued at a market cap of $12.6 billion, Host Hotels & Resorts, Inc. (HST) is a lodging real estate investment trust (REIT) that owns and invests in upscale and luxury hotels and resorts. The Bethesda, Maryland-based company operates under leading global brands, including Marriott, Ritz-Carlton, Hyatt, and Four Seasons.
Companies valued at $10 billion or more are typically classified as “large-cap stocks,” and HST fits the label perfectly, with its market cap exceeding this threshold, underscoring its size, influence, and dominance within the REIT - hotel & motel industry. The company benefits from significant scale, geographic diversification, and strong relationships with leading global hotel brands, allowing for efficient asset management and disciplined capital allocation.
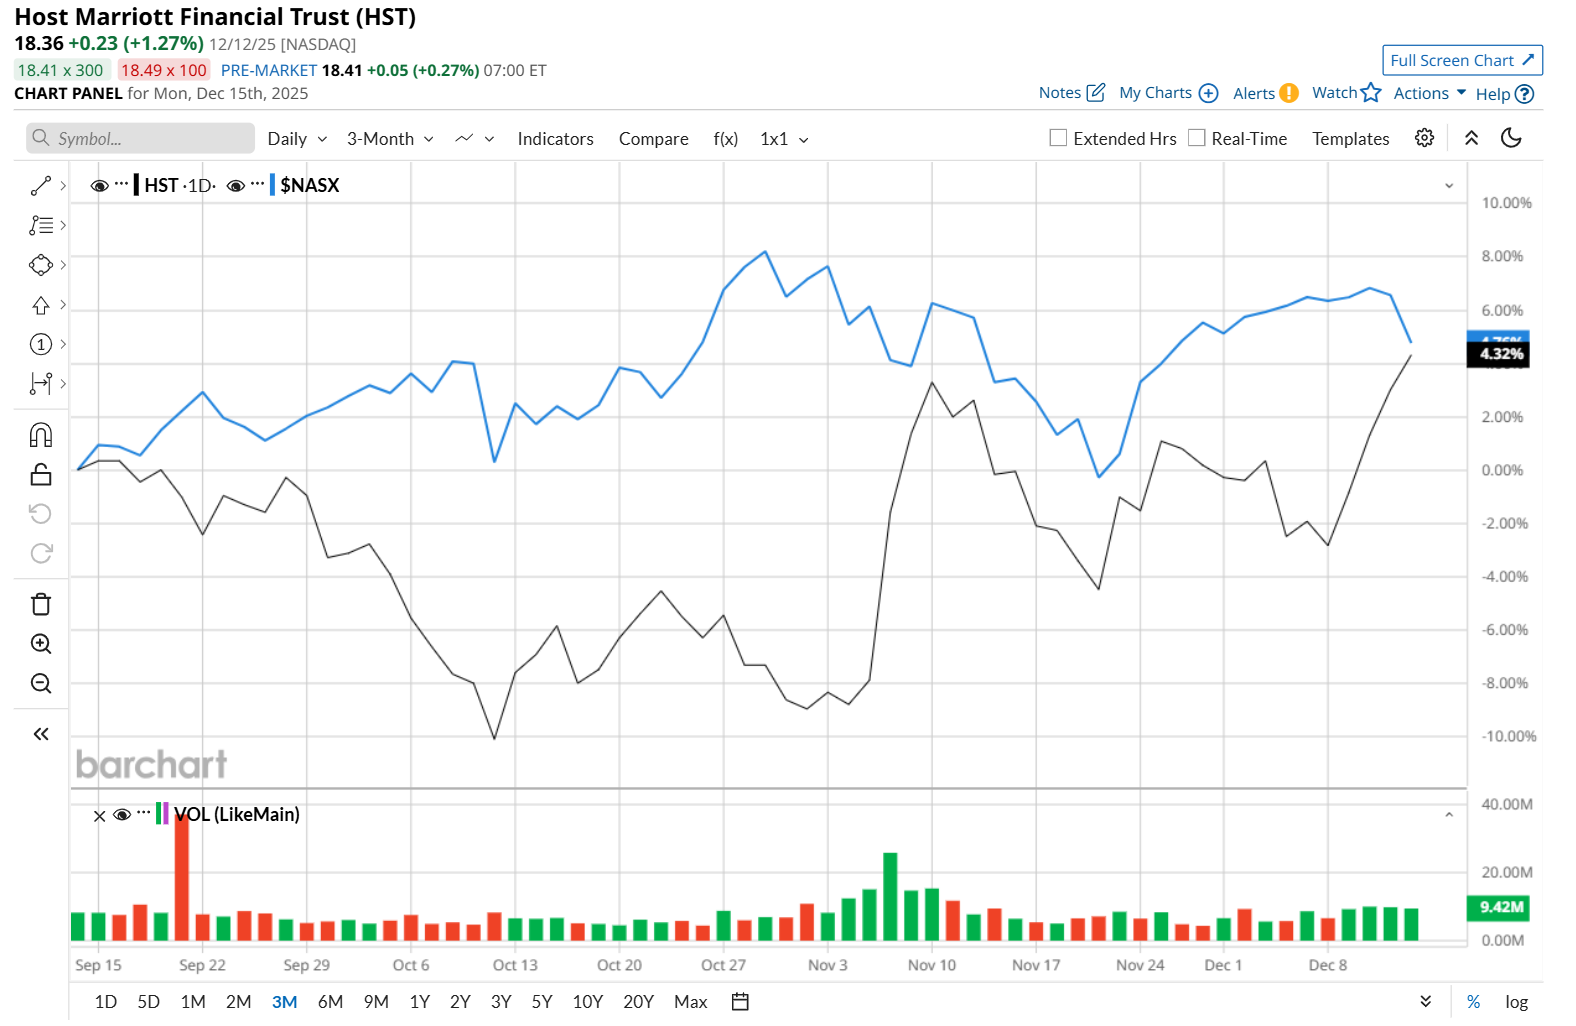
This hotel REIT is currently trading 3.5% below its 52-week high of $19.03, reached on Dec. 16, 2024. Shares of HST have gained 4.3% over the past three months, slightly underperforming the Nasdaq Composite’s ($NASX) 4.8% rise during the same time frame.
In the longer term, HST has declined marginally over the past 52 weeks, considerably lagging behind NASX’s 16.5% uptick over the same time frame. Moreover, on a YTD basis, shares of HST are up 5.1%, compared to NASX’s 20.1% return.
To confirm its recent bullish trend, HST has been trading above its 200-day moving average since late August, with minor fluctuations, and has remained above its 50-day moving average since early November, with slight fluctuations.

On Nov. 5, HST delivered impressive Q3 results, and its shares surged 6.9% in the following trading session. The company’s revenue increased marginally year-over-year to $1.3 billion and met the consensus estimates. Meanwhile, its adjusted FFO of $0.35 declined 2.8% from the year-ago quarter, but topped analyst expectations of $0.33. Additionally, its comparable hotel total RevPAR reached $335.4 million, driven by strong transient demand.
HST has considerably outpaced its rival, Park Hotels & Resorts Inc. (PK), which declined 28% over the past 52 weeks and 21.8% on a YTD basis.
Despite HST’s recent underperformance, analysts remain moderately optimistic about its prospects. The stock has a consensus rating of "Moderate Buy” from the 18 analysts covering it, and the mean price target of $19.74 suggests an 8.2% premium to its current price levels.
On the date of publication, Neharika Jain did not have (either directly or indirectly) positions in any of the securities mentioned in this article. All information and data in this article is solely for informational purposes. For more information please view the Barchart Disclosure Policy here.
More news from Barchart
- Why Are Investors Excited About Carvana Stock?
- Michael Burry Is Betting Big on Freddie Mac Stock Ahead of a Relisting. Should You?
- Google Is Planning to Launch AI Glasses in 2026. This 1 Stock to Buy Could Be the Biggest Winner.
- As Trump Considers Signing a Cannabis Executive Order, Should You Buy the Dip in Tilray Stock?