ETFOptimize | High-performance ETF-based Investment Strategies

Quantitative strategies, Wall Street-caliber research, and insightful market analysis since 1998.


ETFOptimize | HOME
Close Window

Is Stanley Black & Decker Stock Underperforming the Nasdaq?

Stanley Black & Decker, Inc. (SWK), based in New Britain, Connecticut, is a diversified global provider of hand tools, power tools and related accessories, mechanical access and electronic security solutions, healthcare solutions, engineered fastening systems, and more. Valued at $11.7 billion by market cap, the company offers onshore and offshore pipeline construction and inspection services.

Companies worth $10 billion or more are generally described as “large-cap stocks,” and SWK perfectly fits that description, with its market cap exceeding this mark, underscoring its size, influence, and dominance within the tools & accessories industry. SWK's strengths include its diversified portfolio, scale, and brand equity, enabling the company to leverage resources and drive growth. Its robust balance sheet, technological capabilities, and innovation ecosystem also position it for success, with a strong strategic fit for trends such as cordless power tools, thereby driving premium pricing and customer loyalty.


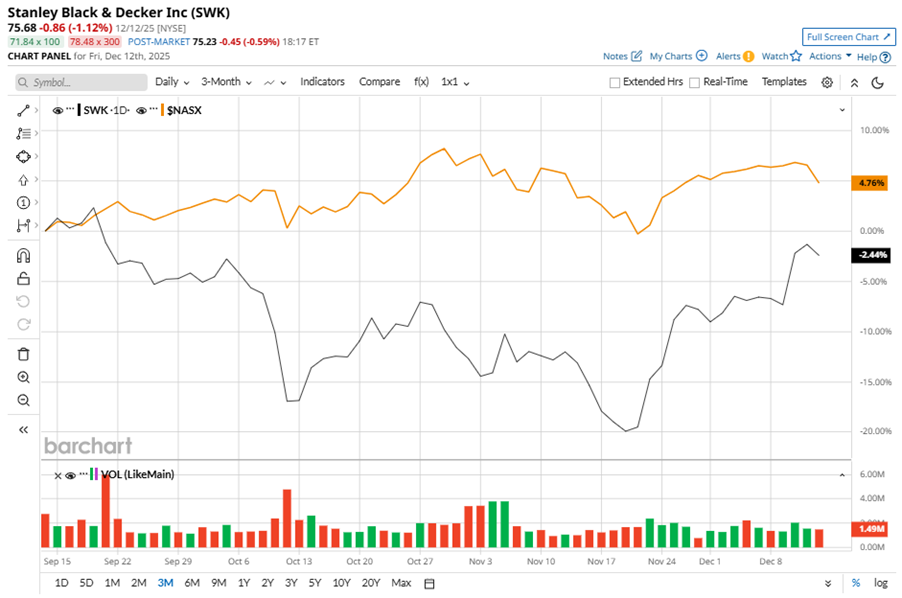
Despite its notable strength, SWK slipped 16.9% from its 52-week high of $91.06, achieved on Jan. 28. Over the past three months, SWK stock has declined 2.4%, underperforming the Nasdaq Composite’s ($NASX) 4.8% gains during the same time frame. 

www.barchart.com

In the longer term, shares of SWK rose 12.3% on a six-month basis but dipped 8.5% over the past 52 weeks, underperforming NASX’s six-month gains of 18% and solid 16.5% returns over the last year.

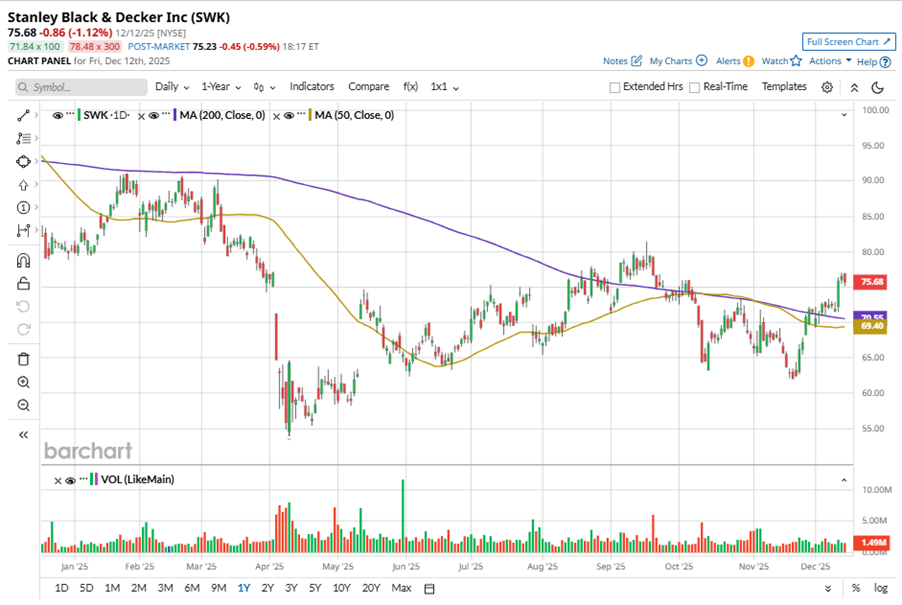
To confirm the recent bullish trend, SWK has been trading above its 50-day and 200-day moving averages since late November, with minor fluctuations. 

www.barchart.com

SWK’s weak performance stems from pressure from declining sales volumes. 

On Nov. 4, SWK reported its Q3 results, and its shares closed up more than 4% in the following trading session. Its adjusted EPS of $1.43 exceeded Wall Street expectations of $1.19. The company’s revenue was $3.76 billion, falling short of Wall Street forecasts of $3.77 billion.

SWK’s rival, Snap-on Incorporated (SNA), has lagged behind the stock, with 9.9% gains on a six-month basis, but outpaced the stock with a 1.4% downtick over the past 52 weeks.

Wall Street analysts are reasonably bullish on SWK’s prospects. The stock has a consensus “Moderate Buy” rating from the 16 analysts covering it, and the mean price target of $81.33 suggests a potential upside of 7.5% from current price levels.


On the date of publication, Neha Panjwani did not have (either directly or indirectly) positions in any of the securities mentioned in this article. All information and data in this article is solely for informational purposes. For more information please view the Barchart Disclosure Policy here.


More news from Barchart

Recent Quotes

View More
Symbol Price Change (%)
AMZN  222.24
-0.30 (-0.14%)
AAPL  273.79
-0.32 (-0.12%)
AMD  208.04
+0.46 (0.22%)
BAC  55.02
-0.31 (-0.57%)
GOOG  306.25
-3.07 (-0.99%)
META  655.74
+8.23 (1.27%)
MSFT  475.51
+0.69 (0.15%)
NVDA  176.78
+0.50 (0.28%)
ORCL  188.60
+3.68 (1.99%)
TSLA  480.55
+5.24 (1.10%)
Stock Quote API & Stock News API supplied by www.cloudquote.io
Quotes delayed at least 20 minutes.
By accessing this page, you agree to the Privacy Policy and Terms Of Service.


IntelligentValue Home
Close Window

DISCLAIMER

All content herein is issued solely for informational purposes and is not to be construed as an offer to sell or the solicitation of an offer to buy, nor should it be interpreted as a recommendation to buy, hold or sell (short or otherwise) any security.  All opinions, analyses, and information included herein are based on sources believed to be reliable, but no representation or warranty of any kind, expressed or implied, is made including but not limited to any representation or warranty concerning accuracy, completeness, correctness, timeliness or appropriateness. We undertake no obligation to update such opinions, analysis or information. You should independently verify all information contained on this website. Some information is based on analysis of past performance or hypothetical performance results, which have inherent limitations. We make no representation that any particular equity or strategy will or is likely to achieve profits or losses similar to those shown. Shareholders, employees, writers, contractors, and affiliates associated with ETFOptimize.com may have ownership positions in the securities that are mentioned. If you are not sure if ETFs, algorithmic investing, or a particular investment is right for you, you are urged to consult with a Registered Investment Advisor (RIA). Neither this website nor anyone associated with producing its content are Registered Investment Advisors, and no attempt is made herein to substitute for personalized, professional investment advice. Neither ETFOptimize.com, Global Alpha Investments, Inc., nor its employees, service providers, associates, or affiliates are responsible for any investment losses you may incur as a result of using the information provided herein. Remember that past investment returns may not be indicative of future returns.

Copyright © 1998-2017 ETFOptimize.com, a publication of Optimized Investments, Inc. All rights reserved.