ETFOptimize | High-performance ETF-based Investment Strategies

Quantitative strategies, Wall Street-caliber research, and insightful market analysis since 1998.


ETFOptimize | HOME
Close Window

Is Trimble Stock Underperforming the Nasdaq?

Westminster, Colorado-based Trimble Inc. (TRMB) is an original equipment manufacturer of positioning, surveying, and machine control products. Valued at $19.1 billion by a market cap, Trimble amalgamates physical and digital worlds through hardware, software, and services across agriculture, construction, geospatial, and transportation industries.

Companies worth $10 billion or more are generally described as "large-cap stocks." Trimble fits right into that category, with its market cap exceeding this threshold, reflecting its substantial size and influence in the scientific & technical instruments industry. Its solutions enable customers to work in new ways to measure, build, grow, and move goods for a better quality of life.


Trimble touched its three-year high of $87.50 on Aug. 6 and is currently trading 8.3% below that peak. Meanwhile, TRMB stock prices have dipped 77 bps over the past three months, notably underperforming the Nasdaq Composite’s ($NASX4.8% gains during the same time frame.

www.barchart.com

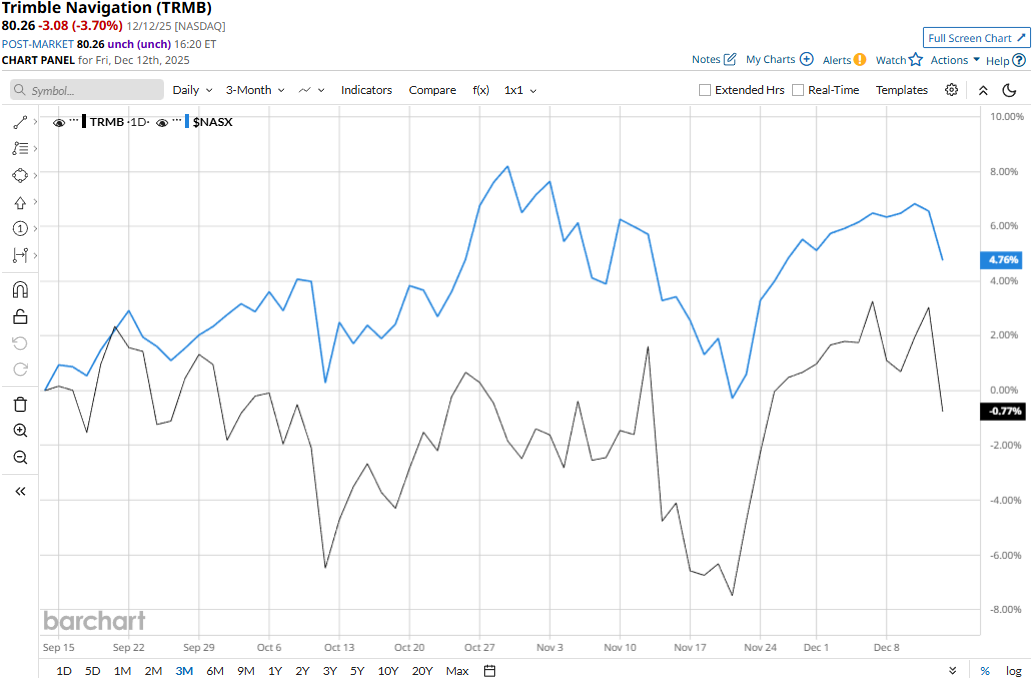
Trimble has lagged behind the Nasdaq over the longer term as well. TRMB stock prices have gained 13.6% on a YTD basis and 7.2% over the past 52 weeks, compared to NASX’s 20.1% surge in 2025 and 16.5% gains over the past year.

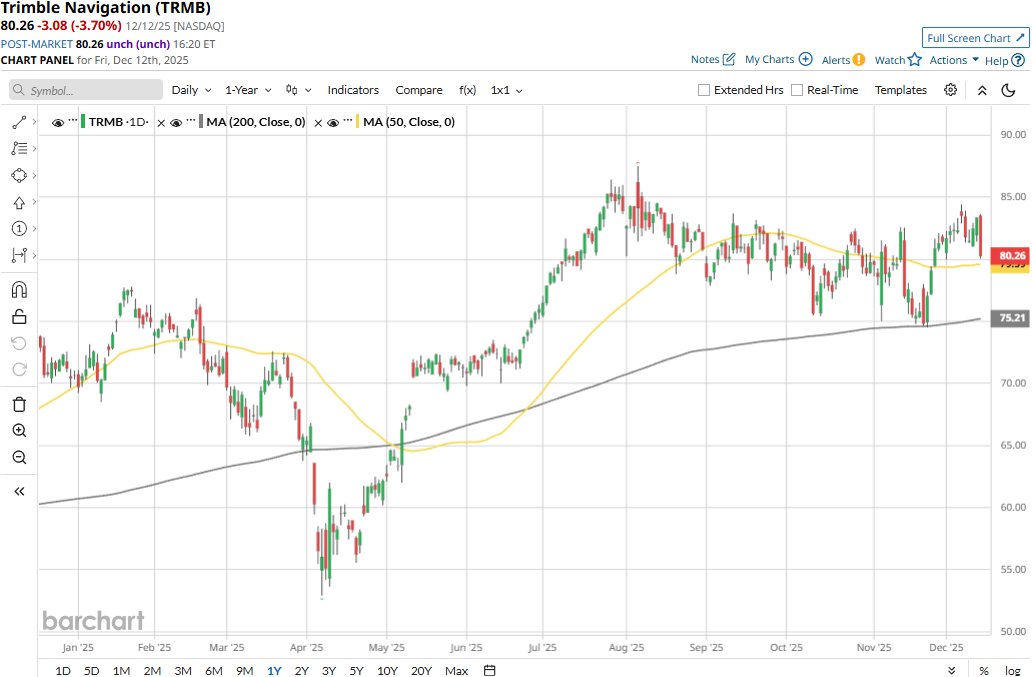
TRMB stock has traded consistently above its 200-day moving average since early May and above its 50-day moving average since late November, underscoring its bullish trend.

www.barchart.com

Trimble’s stock prices gained 2.5% in the trading session following the release of its impressive Q3 results on Nov. 5. The company observed a notable surge in organic revenues, which pushed its topline and annualized recurring revenues. Driven by a surge in subscription and services revenues, the company’s overall topline grew 2.9% year-over-year to $901.2 million. Further, its adjusted EPS soared 15.7% year-over-year to $0.81, beating the consensus estimates by 12.5%.

Meanwhile, Trimble has notably outperformed its peer, Fortive Corporation’s (FTV26.8% decline on a YTD basis and 28.5% plunge over the past 52 weeks.

Among the 13 analysts covering the TRMB stock, the consensus rating is a “Strong Buy.” Its mean price target of $97.70 suggests a 21.7% upside potential from current price levels.


On the date of publication, Aditya Sarawgi did not have (either directly or indirectly) positions in any of the securities mentioned in this article. All information and data in this article is solely for informational purposes. For more information please view the Barchart Disclosure Policy here.


More news from Barchart

Recent Quotes

View More
Symbol Price Change (%)
AMZN  222.56
+0.02 (0.01%)
AAPL  274.61
+0.50 (0.18%)
AMD  209.17
+1.59 (0.77%)
BAC  54.81
-0.52 (-0.94%)
GOOG  307.73
-1.59 (-0.51%)
META  657.15
+9.64 (1.49%)
MSFT  476.39
+1.57 (0.33%)
NVDA  177.72
+1.43 (0.81%)
ORCL  188.65
+3.73 (2.02%)
TSLA  489.88
+14.57 (3.07%)
Stock Quote API & Stock News API supplied by www.cloudquote.io
Quotes delayed at least 20 minutes.
By accessing this page, you agree to the Privacy Policy and Terms Of Service.


IntelligentValue Home
Close Window

DISCLAIMER

All content herein is issued solely for informational purposes and is not to be construed as an offer to sell or the solicitation of an offer to buy, nor should it be interpreted as a recommendation to buy, hold or sell (short or otherwise) any security.  All opinions, analyses, and information included herein are based on sources believed to be reliable, but no representation or warranty of any kind, expressed or implied, is made including but not limited to any representation or warranty concerning accuracy, completeness, correctness, timeliness or appropriateness. We undertake no obligation to update such opinions, analysis or information. You should independently verify all information contained on this website. Some information is based on analysis of past performance or hypothetical performance results, which have inherent limitations. We make no representation that any particular equity or strategy will or is likely to achieve profits or losses similar to those shown. Shareholders, employees, writers, contractors, and affiliates associated with ETFOptimize.com may have ownership positions in the securities that are mentioned. If you are not sure if ETFs, algorithmic investing, or a particular investment is right for you, you are urged to consult with a Registered Investment Advisor (RIA). Neither this website nor anyone associated with producing its content are Registered Investment Advisors, and no attempt is made herein to substitute for personalized, professional investment advice. Neither ETFOptimize.com, Global Alpha Investments, Inc., nor its employees, service providers, associates, or affiliates are responsible for any investment losses you may incur as a result of using the information provided herein. Remember that past investment returns may not be indicative of future returns.

Copyright © 1998-2017 ETFOptimize.com, a publication of Optimized Investments, Inc. All rights reserved.