ETFOptimize | High-performance ETF-based Investment Strategies

Quantitative strategies, Wall Street-caliber research, and insightful market analysis since 1998.


ETFOptimize | HOME
Close Window

Is Universal Health Services Stock Outperforming the S&P 500?

King of Prussia, Pennsylvania-based Universal Health Services, Inc. (UHS) is a healthcare company that owns and operates acute care hospitals, behavioral health facilities, and outpatient facilities. Valued at a market cap of $13.9 billion, the company provides a broad range of medical services, including emergency care, surgery, diagnostic services, and mental health treatment.

Companies worth $10 billion or more are typically classified as “large-cap stocks,” and UHS fits the label perfectly, with its market cap exceeding this threshold, underscoring its size, influence, and dominance within the medical care facilities industry. The company focuses on delivering essential healthcare across diverse communities, benefiting from scale, operational expertise, and steady demand driven by demographic and healthcare needs.


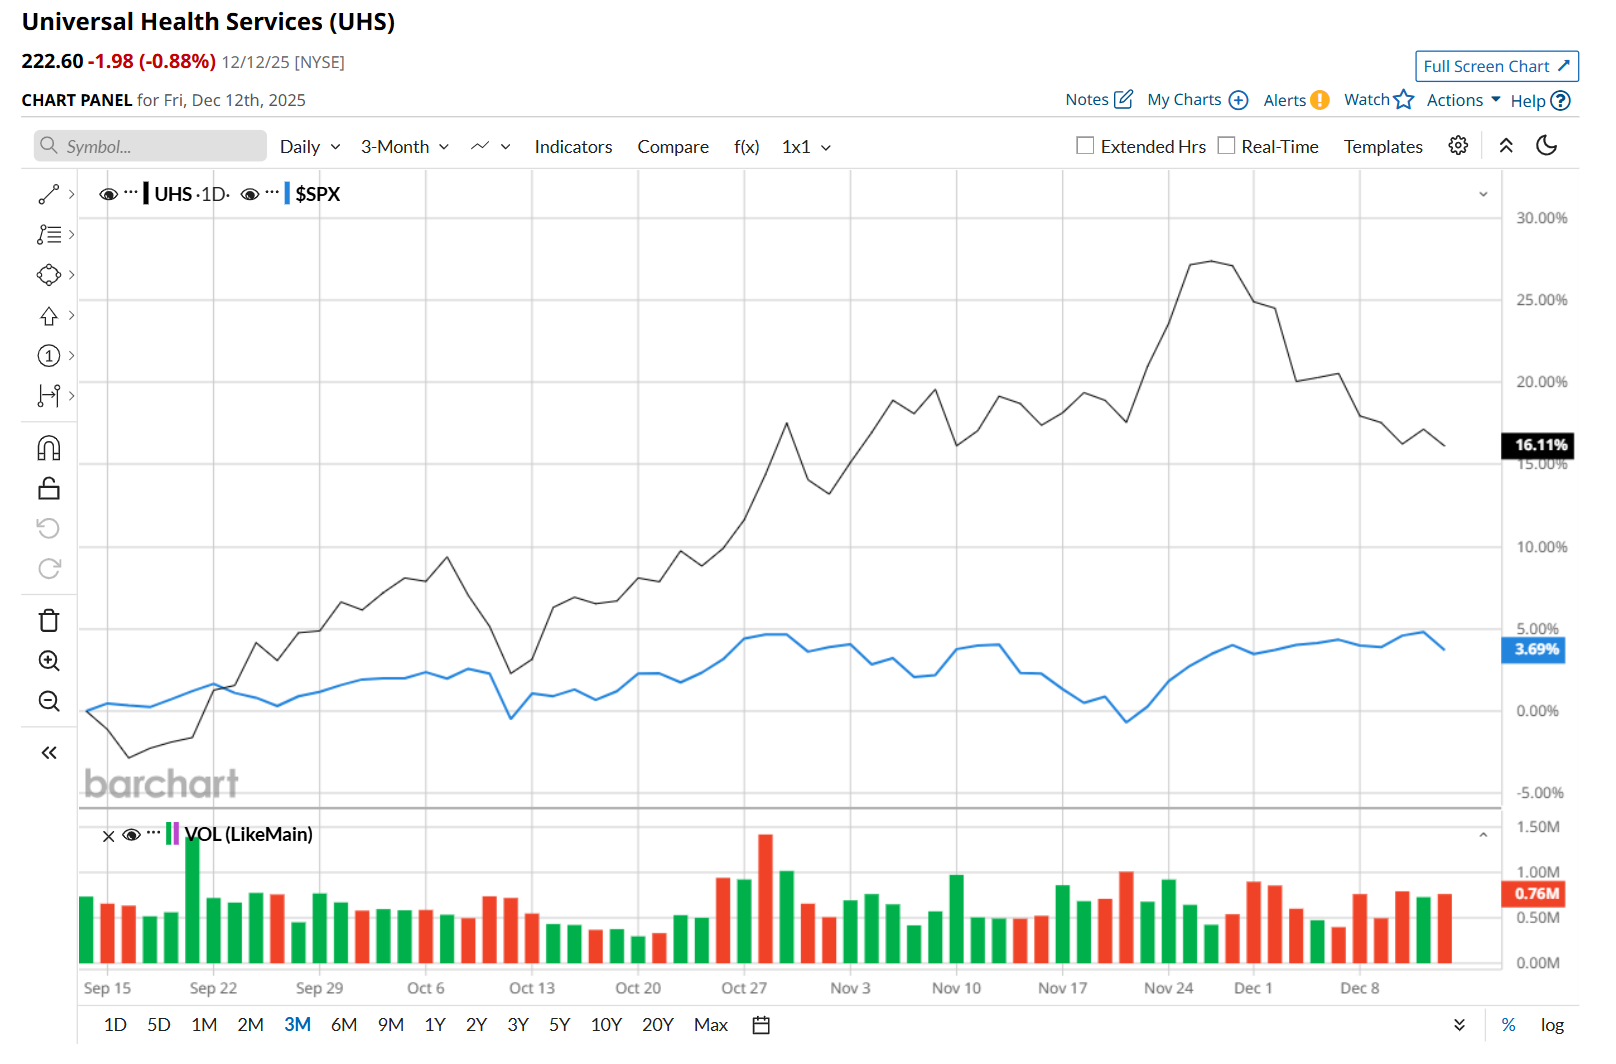
This healthcare company is currently trading 9.6% below its 52-week high of $246.33, reached on Nov. 26. Shares of UHS have gained 16.1% over the past three months, outperforming the S&P 500 Index’s ($SPX3.7% rise during the same time frame.

www.barchart.com 

In the longer term, UHS has rallied 19.4% over the past 52 weeks, outpacing SPX’s 12.8% uptick over the same time frame. Moreover, on a YTD basis, shares of UHS are up 24.1%, compared to SPX’s 16.1% return. 

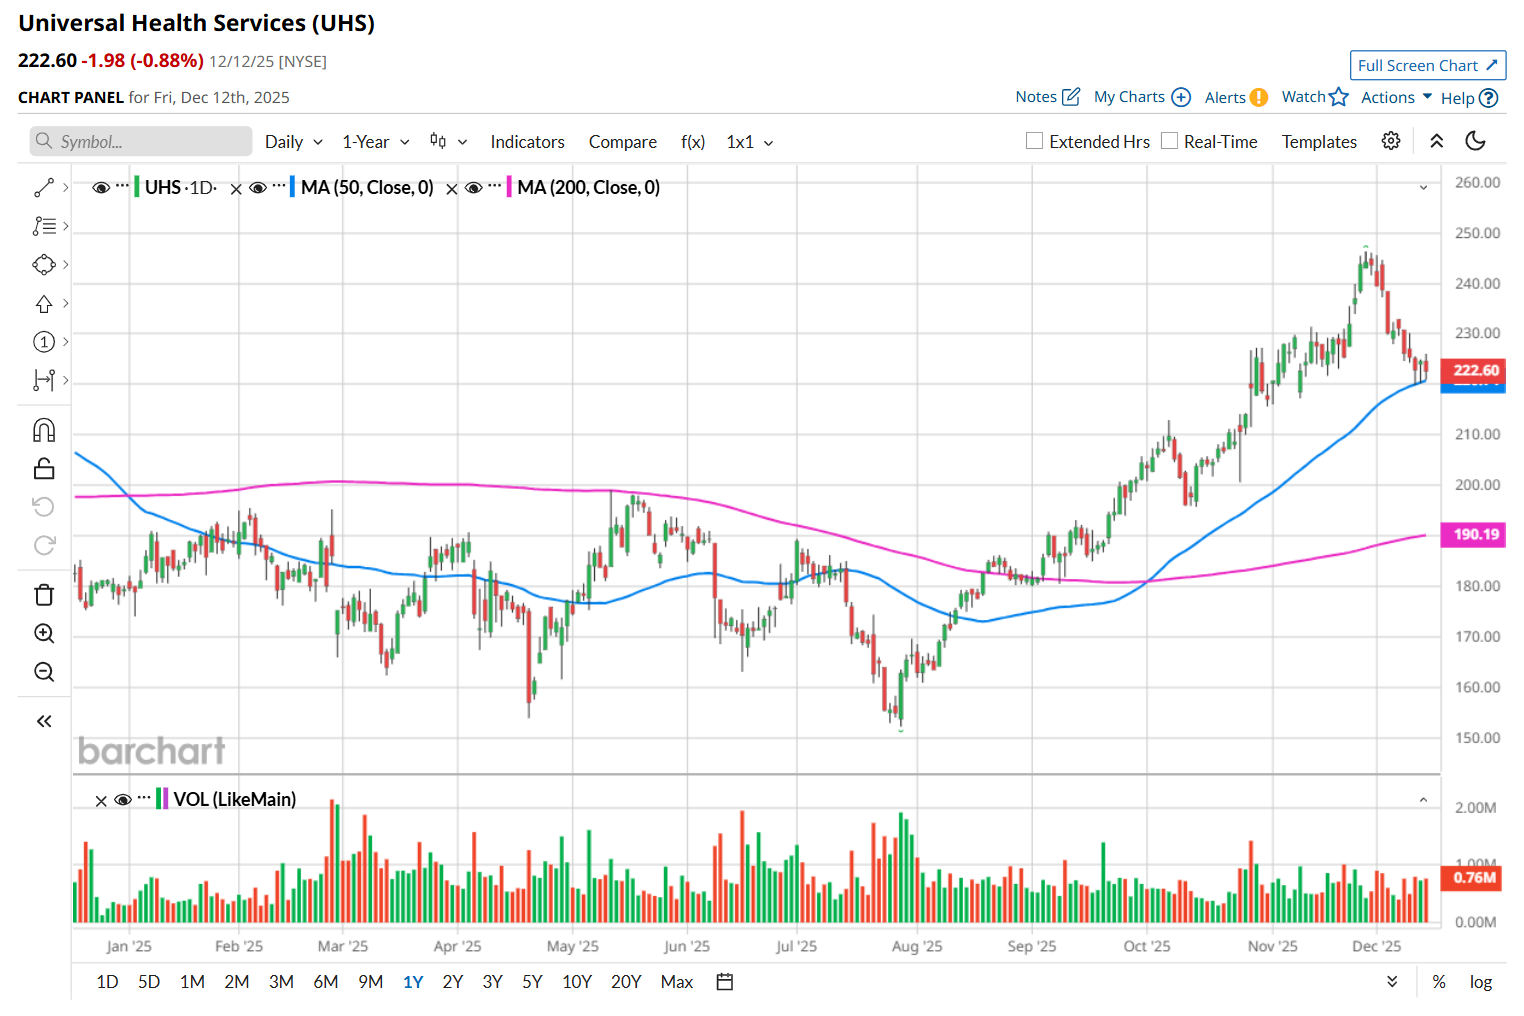
To confirm its bullish trend, UHS has been trading above its 200-day moving average since early September, and has remained above its 50-day moving average since mid-August. 

www.barchart.com 

On Oct. 27, UHS delivered better-than-expected Q3 earnings results, driving its shares up 2.5% in the following trading session. The company’s overall revenue improved 13.4% year-over-year to $4.5 billion, surpassing consensus estimates by 4.4%. Moreover, its adjusted EPS increased by an even more impressive 53.4% from the year-ago quarter to $5.69, handily topping analyst expectations of $4.66. Additionally, UHS raised its fiscal 2025 revenue and earnings guidance, underscoring strong operating momentum and further boosting investor confidence.

UHS has lagged behind its rival, HCA Healthcare, Inc. (HCA), which soared 55.4% over the past 52 weeks and 61.5% on a YTD basis.  

Looking at UHS’ recent outperformance, analysts remain moderately optimistic about its prospects. The stock has a consensus rating of "Moderate Buy” from the 20 analysts covering it, and the mean price target of $252.18, suggests a 23.2% premium to its current price levels. 


On the date of publication, Neharika Jain did not have (either directly or indirectly) positions in any of the securities mentioned in this article. All information and data in this article is solely for informational purposes. For more information please view the Barchart Disclosure Policy here.


More news from Barchart

Recent Quotes

View More
Symbol Price Change (%)
AMZN  223.01
+0.47 (0.21%)
AAPL  275.10
+0.99 (0.36%)
AMD  209.41
+1.83 (0.88%)
BAC  54.90
-0.43 (-0.79%)
GOOG  307.55
-1.77 (-0.57%)
META  661.10
+13.59 (2.10%)
MSFT  476.29
+1.47 (0.31%)
NVDA  177.69
+1.40 (0.79%)
ORCL  188.77
+3.85 (2.08%)
TSLA  489.61
+14.30 (3.01%)
Stock Quote API & Stock News API supplied by www.cloudquote.io
Quotes delayed at least 20 minutes.
By accessing this page, you agree to the Privacy Policy and Terms Of Service.


IntelligentValue Home
Close Window

DISCLAIMER

All content herein is issued solely for informational purposes and is not to be construed as an offer to sell or the solicitation of an offer to buy, nor should it be interpreted as a recommendation to buy, hold or sell (short or otherwise) any security.  All opinions, analyses, and information included herein are based on sources believed to be reliable, but no representation or warranty of any kind, expressed or implied, is made including but not limited to any representation or warranty concerning accuracy, completeness, correctness, timeliness or appropriateness. We undertake no obligation to update such opinions, analysis or information. You should independently verify all information contained on this website. Some information is based on analysis of past performance or hypothetical performance results, which have inherent limitations. We make no representation that any particular equity or strategy will or is likely to achieve profits or losses similar to those shown. Shareholders, employees, writers, contractors, and affiliates associated with ETFOptimize.com may have ownership positions in the securities that are mentioned. If you are not sure if ETFs, algorithmic investing, or a particular investment is right for you, you are urged to consult with a Registered Investment Advisor (RIA). Neither this website nor anyone associated with producing its content are Registered Investment Advisors, and no attempt is made herein to substitute for personalized, professional investment advice. Neither ETFOptimize.com, Global Alpha Investments, Inc., nor its employees, service providers, associates, or affiliates are responsible for any investment losses you may incur as a result of using the information provided herein. Remember that past investment returns may not be indicative of future returns.

Copyright © 1998-2017 ETFOptimize.com, a publication of Optimized Investments, Inc. All rights reserved.