Huntington Ingalls Industries, Inc. (HII) is a leading U.S. military shipbuilding company and a prominent provider of professional services to government and industry clients. Headquartered in Newport News, Virginia, HII was formed in March 2011 following the spin-off of Northrop Grumman’s (NOC) shipbuilding operations. Its operations span three main divisions, Newport News Shipbuilding, Ingalls Shipbuilding, and Mission Technologies, encompassing design, construction, overhaul, maintenance, and services across naval platforms and defense systems. The company has a market cap of $12.9 billion.
Companies with a market cap of $10 billion or more are typically recognized as “large-cap stocks,” a designation that highlights their financial strength, resilience, and influence within their industries. Huntington Ingalls Industries comfortably falls into this category, underscoring its scale, stability, and competitive advantage. HII’s trusted expertise, long-standing defense contracts, and strategic role in national security reinforce its prominence and growth potential among peers in the defense sector.
HII is just 1.3% below its 52-week high of $333.31, reached on Dec. 12. The shipbuilding company stock has gained 20.6% over the past three months, outpacing the broader SPDR S&P Aerospace & Defense ETF’s (XAR) 4.8% return over the same time frame.
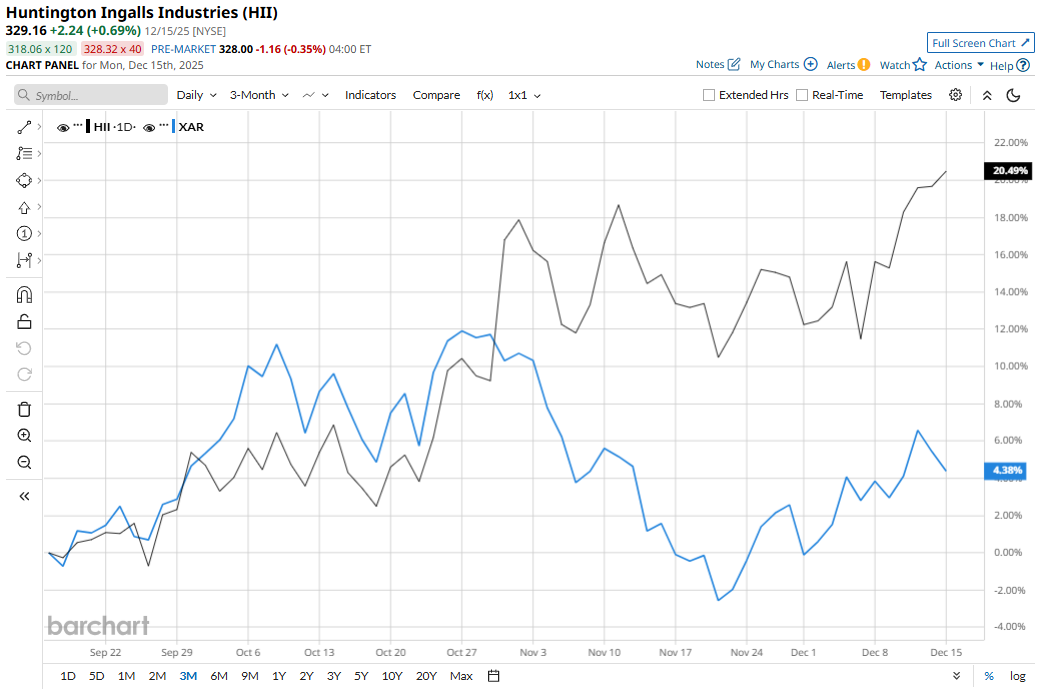
In the longer term, the stock has risen 74.2% on a YTD basis, outperforming XAR’s 41.3% gains. Moreover, shares have increased 71.3% over the past 52 weeks, beating XAR’s 39.2% returns over the same time frame.
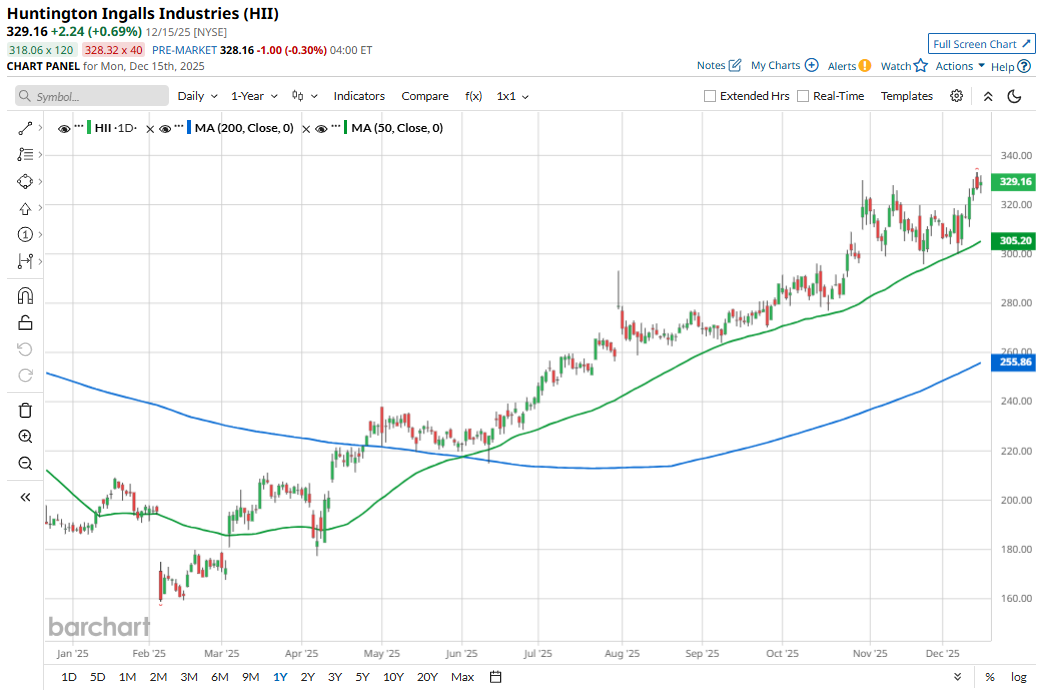
To confirm the bullish trend, HII has been trading above the 50-day moving average since early April and above the 200-day moving average since late April.
The stock is moving higher as recent earnings beats point to improving execution, while the company is scaling up shipbuilding capacity and accelerating its push into unmanned maritime systems, supported by strategic partnerships and initiatives such as the ROMULUS autonomous vessel program, which are lifting expectations for long-term growth.
In fact, the 52-week high reached last week was propelled by the company announcement that construction of its ROMULUS prototype had reached 30% completion, marking a key development milestone and keeping the project on track for sea trials in late 2026.
In the most recent quarter (Q3 2025), the company reported revenues of a record $3.2 billion, up 16.1% from the third quarter of 2024, while total backlog stood at $55.7 billion as of Sept. 30, 2025.
Adding to the momentum, the U.S. defense and political environment is increasingly supportive of domestic shipbuilding, with efforts to strengthen the naval industrial base creating a favorable tailwind for contractors like HII.
HII has also outpaced its rival, General Dynamics Corporation’s (GD) 29.3% gains YTD and 29.5% over the past year.
Wall Street analysts are moderately bullish on HII’s prospects. The stock has a consensus “Moderate Buy” rating from the 12 analysts covering it, and the mean price target of $332.90 suggests a potential upside of 1.1% from current price levels.
On the date of publication, Subhasree Kar did not have (either directly or indirectly) positions in any of the securities mentioned in this article. All information and data in this article is solely for informational purposes. For more information please view the Barchart Disclosure Policy here.
More news from Barchart


