Irvine, California-based Skyworks Solutions, Inc. (SWKS) designs, manufactures, and markets a broad range of high-performance analog and mixed signal semiconductors that enable wireless connectivity. With a market cap of $9.8 billion, the company’s operations span the US, Indo-Pacific, and EMEA region.
Companies worth between $2 billion and $10 billion are generally described as "mid-cap stocks." SWKS fits right into that category, with its market cap exceeding this threshold, reflecting its substantial size and influence in the semiconductor industry.
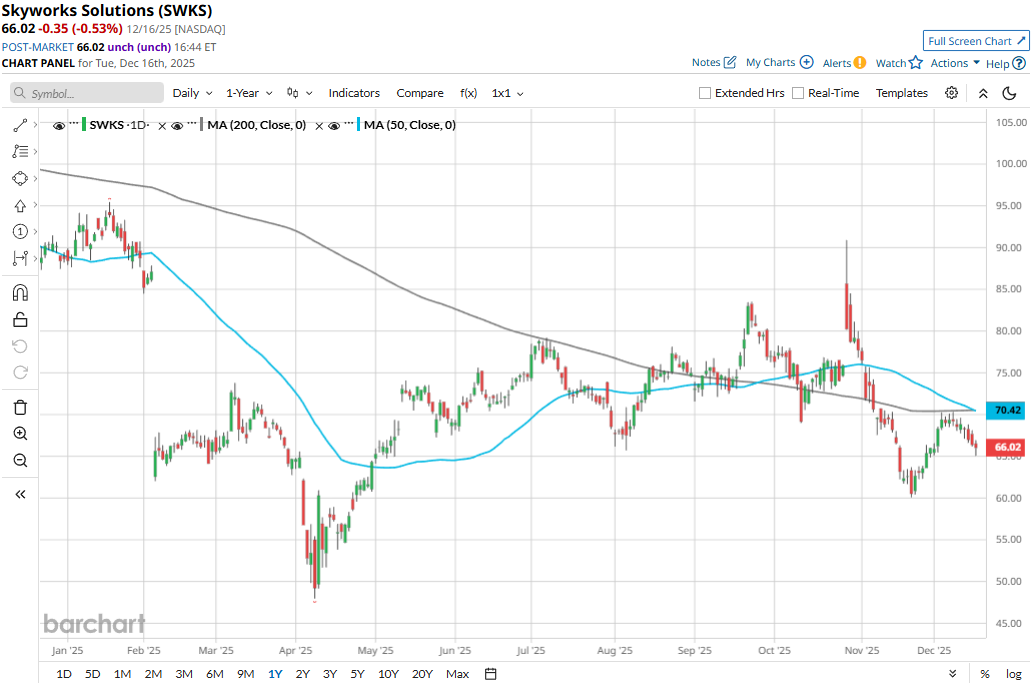
Skyworks touched its 52-week high of $95.46 on Jan. 21 and is currently trading 30.8% below that peak. Meanwhile, SWKS stock has declined 11.1% over the past three months, notably lagging behind the iShares Semiconductor ETF’s (SOXX) 14.6% surge during the same time frame.
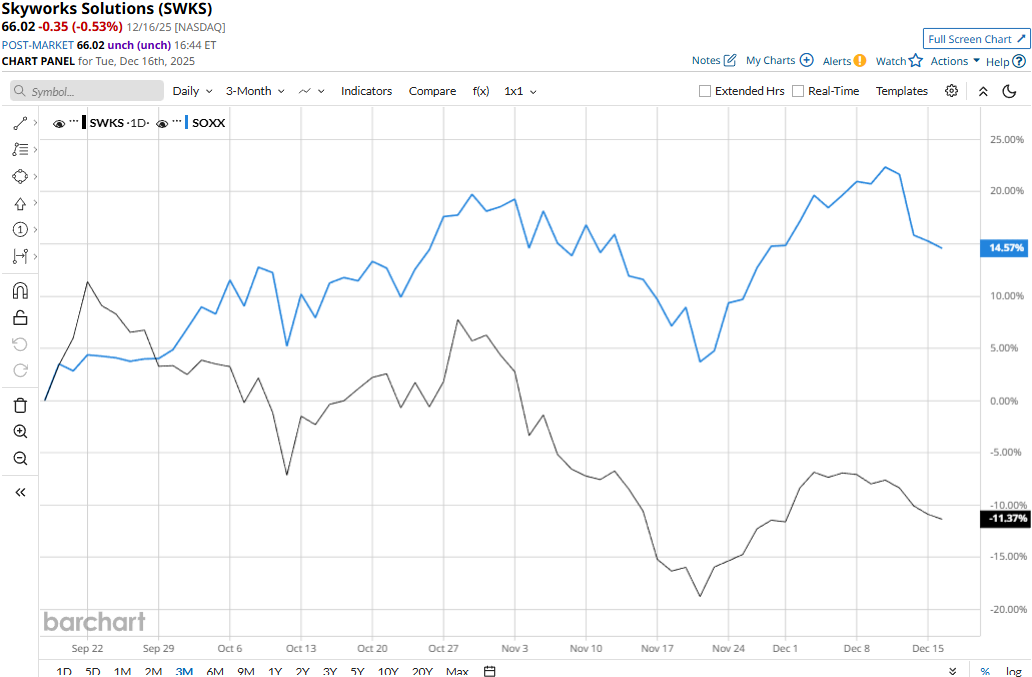
Skyworks’ performance has remained grim over the longer term as well. SWKS stock has plunged 25.6% on a YTD basis and 27.3% over the past 52 weeks, significantly underperforming SOXX’s 37.5% surge in 2025 and 30.2% returns over the past year.
SWKS stock has traded mostly below its 200-day moving average over the past year, with some notable fluctuations and consistently below its 50-day moving average since early November, underscoring its bearish trend.
Skyworks Solutions’ stock prices gained more than 2% in the trading session following the release of its impressive Q4 results on Nov. 4. During the quarter, the company secured 5G content across premium Android smartphones, including Google Pixel 10, Samsung Galaxy S25, and others. Further, it also expanded in-vehicle infotainment programs with BYD, Stellantis, and a leading Korean OEM.
Meanwhile, Skyworks reported a notable 7.3% year-over-year growth in revenues to $1.1 billion, beating the Street’s expectations by a significant margin. Moreover, SWKS delivered a notable 13.5% increase in adjusted EPS to $1.76, surpassing the consensus estimates by more than 15%.
Nonetheless, Skyworks has also underperformed its peer, Analog Devices, Inc.’s (ADI) 31% surge in 2025 and 28.7% returns over the past 52 weeks.
Among the 25 analysts covering the SWKS stock, the consensus rating is a “Hold.” Its mean price target of $84.56 suggests a 28.1% upside potential from current price levels.
On the date of publication, Aditya Sarawgi did not have (either directly or indirectly) positions in any of the securities mentioned in this article. All information and data in this article is solely for informational purposes. For more information please view the Barchart Disclosure Policy here.
More news from Barchart
- This High-Yield Dividend Stock Trades at a Third of Its Record Highs: Is It a Buy for 2026?
- Elon Musk Warns He Wants to ‘Slow Down AI and Robotics’ But Says It’s Impossible and ‘Advancing at a Very Rapid Pace’
- Buy the Dip, or Panic Sell? What This Powerful Chart Indicator is Telling Us About the Stock Market Now.
- Should You Buy the Dip in Alibaba Stock?