Huge, unusual volume of out-of-the-money (OTM) put options activity in Oracle Corp (ORCL) stock may be a contrarian signal. Are investors overlooking its long-term value? This article focuses on its operating cash flow, analysts' revenue estimates, and derives a 12-month target price.
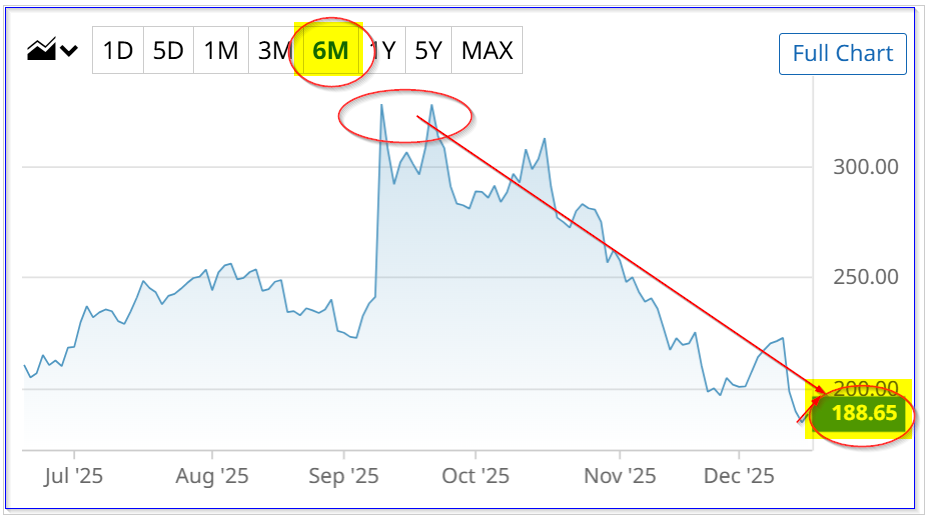
ORCL was up on Tuesday, Dec. 16, 2025, to $188.65, after hitting a recent low the day before at $184.92. Has it bottomed out? Is it time for investors to look closer at ORCL?
That could be the case based on its operating cash flow (OCF) and analysts' significant expectations for revenue next year. But first, let's see what investors are doing with the recent huge volume in ORCL put options.
Unusual Volume in OTM Puts Could Be a Contrarian Buy Signal
This can be seen in Barchart's Unusual Stock Options Activity Report late on Tuesday, Dec. 16. It shows that over 7,300 put option contracts traded at the $172.50 strike price for expiration on Dec. 26, 2025 (10 days from now).
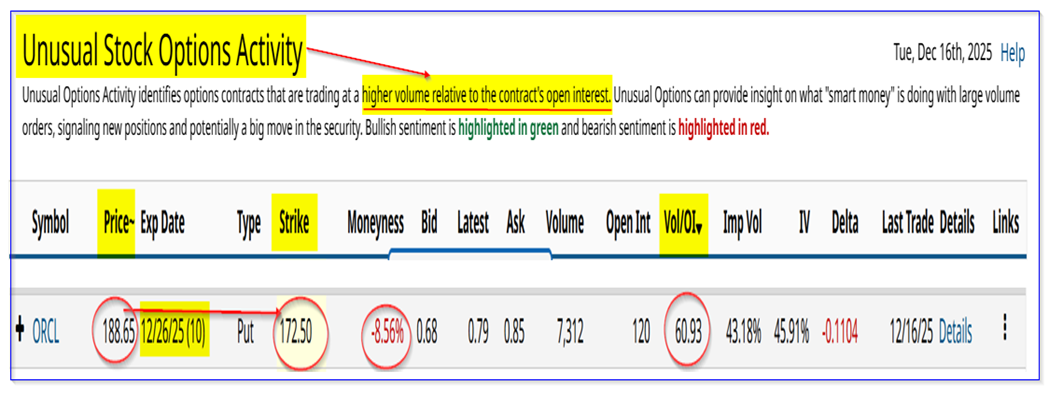
Note the huge volume in this put option. It is over 60 x the prior number of outstanding contracts at that strike price.
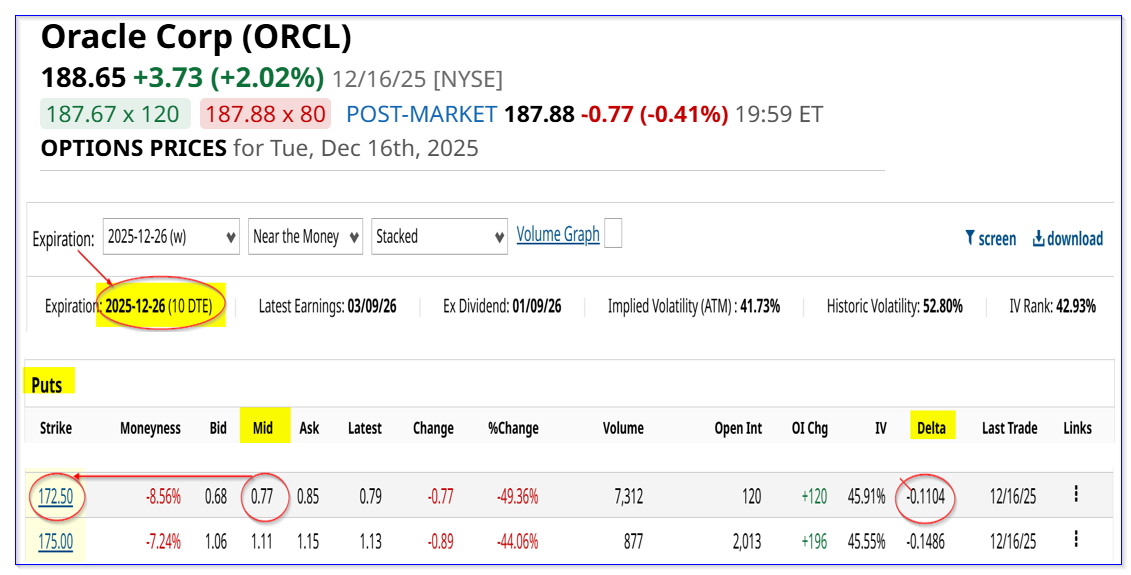
Moreover, that strike price is over 8.5% below the closing price of $188.65 on Tuesday. The midprice premium was 79 cents.
In other words, buyers of these puts think ORCL will fall to at least $171.71, or 9% (i.e., $172.50 - $0.79) below Tuesday's closing price of $188.65.
But will the stock really crater another 9% in 10 days? Most of the “bad news” from its Dec. 10, 2025, earnings release is already digested by the market. (We are going to take a closer look at that).
Moreover, short-sellers of this put contract, who are willing to pay $172.50 for ORCL in 10 days, are making a good yield: $0.79/172.50 = 0.46%. That's equivalent to a one-month yield of 1.373% (i.e., 0.46% x 3).
This is a very attractive yield. Moreover, there seems to be little risk that it will fall to that level. Note that its delta ratio (in the table above) is just -.11, implying just an 11% chance it will drop 8.56% in the next 10 days.
The bottom line is that this huge volume of put activity could be a contrarian signal. ORCL stock may have bottomed.
But, let's review what it could be worth, based on the company's latest earnings report.
FCF Disappoints, But Operating Cash Flow Margins Are High
Despite showing a 54% non-GAAP earnings increase and a 14% YoY rise in revenue, ORCL stock tanked after its Dec. 10 earnings release.
The main reason seems to be its huge negative free cash flow (FCF) performance. For example, the table provided below shows that its trailing 12-month (TTM) FCF was -$13.181 billion.
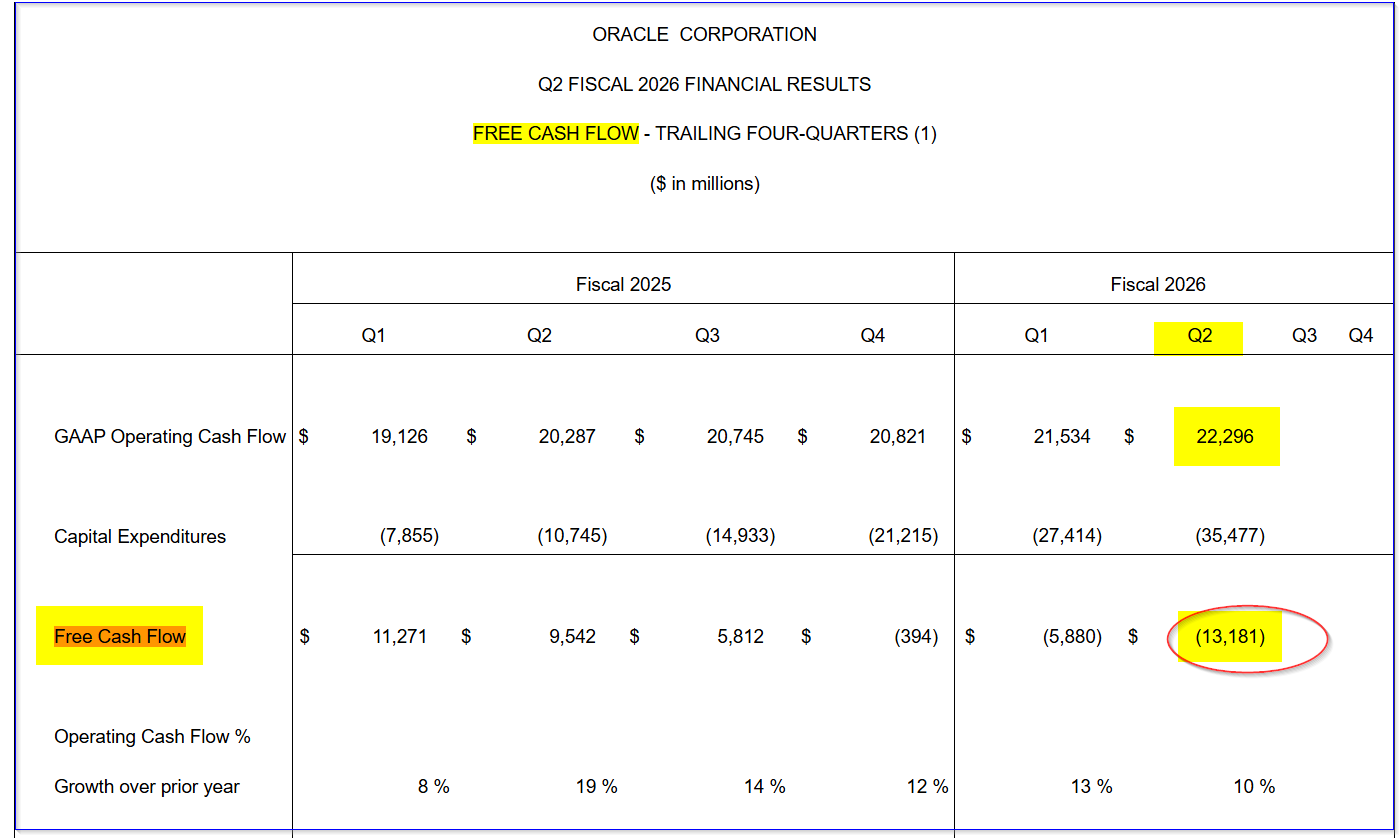
That was worse than the prior quarter TTM FCF of -$5.88 billion. So, no wonder investors' knee-jerk reaction was to sell first, and ask questions later.
But look closer. First of all, its operating cash flow (OCF) rose 10% YoY. That shows its underlying cash flow is still growing.
Second, its capex spending is up significantly (+$8.063 billion from last quarter on a TTM basis). Without that growth in spending on AI data centers and related software, it would have had a positive FCF of $2.183 billion.
Third, Oracle's TTM operating cash flow (OCF) of $22.296 represents over 36.54% of its TTM revenue of $61.016 billion, according to Stock Analysis. This is a very high OCF margin. It's also on par with the prior quarter's OCF margin of 36.48% (see my Nov. 26 Barchart article on ORCL).
Lastly, let's look at revenue projections. Analysts now project that next fiscal year, ending May 2027, Oracle's revenue will rise significantly to $86.95 billion, according to Seeking Alpha.
That implies that its future FCF could resolve to a decent number.
Projecting FCF
For example, let's assume that next FY its operating cash flow margin will stay strong at 37%. That implies OCF could rise to $32 billion (i.e., $10 billion more than its TTM OCF):
0.37 x $87 billion revenue FY 2027 = $32.2 billion OCF
Moreover, if capex spending flattens out to between $27.4 billion and $35.5 billion, or $31.5 billion on average, FCF could become positive:
$32.2b OCF - $31.5b capex spend = $0.7 billion FCF
However, that is a base case scenario. It seems more likely that the company's OCF margin could rise closer to 40%, given its operating leverage with higher revenue:
0.40 x $87b revenue = $34.8 billion OCF
Moreover, capex spending may not need to be as high as before. If it averages $27.4 billion as in Q1, FCF could reach $7.4 billion:
$34.8 OCF - $27.4 capex = $7.4 billion FCF
The average of the base case and this upper case is $4.05 billion in FCF. We can use this to value ORCL stock.
Target Price (TP)
As a result, using a 1.0% FCF yield metric, Oracle's market value could rise to $740 billion:
$7.4b / 0.01 = $740 billion mkt value
That is 36.5% over today's market cap of $542 billion, according to Yahoo! Finance.
Using the average of the base and upper case of $4.05 billion, or a market value of $405 billion. That is 25% lower than today's price.
So, a 50/50 probability estimate gives an average estimate of $572.5 billion, or 5.6% higher than today's $542 billion market value.
That implies a target price (PT) of almost $200 in the next 12 months:
1.056 x $188.65 = $199.21 PT
Analysts agree that ORCL may be too cheap. For example, the average of 44 analysts surveyed by Yahoo! Finance is $291.11. Barchart's mean PT survey is $307.36.
Similarly, AnaChart, which tracks recent analyst write-ups, shows that 26 analysts have an average PT of $219.78.
Summary
The bottom line is that ORCL looks undervalued here. That is from a cash flow standpoint, as well as analysts' target prices.
So, no wonder some short-put investors are willing to buy ORCL stock if it falls to $172.50 in the next 10 days. Besides, the short-put 1.373% one-month yield is attractive as well.
On the date of publication, Mark R. Hake, CFA did not have (either directly or indirectly) positions in any of the securities mentioned in this article. All information and data in this article is solely for informational purposes. For more information please view the Barchart Disclosure Policy here.
More news from Barchart
- Oracle's Unusual Put Options Activity - A Contrarian Signal - Should Investors Buy ORCL Stock?
- How to Buy CSCO for a 2.5% Discount, or Achieve a 19% Annual Return
- Buy the Dip, or Panic Sell? What This Powerful Chart Indicator is Telling Us About the Stock Market Now.
- Option Traders Are Pricing a Nearly 22% Move in Tilray Stock Before the End of 2025. Should You Buy, Sell, or Hold TLRY Here?