Today, we are using the stock screener to find stocks with a Buy rating and then looking at a couple of bullish option trade ideas.
First the stock scanner:
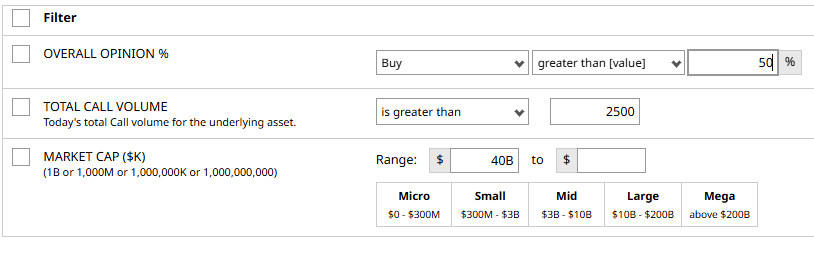
Which produces these results:

The two companies we’re going to look at that meet our criteria are Tesla (TSLA) and Apple (AAPL).
Tesla Bull Put Spread
A bull put spread is a defined risk option strategy that profits if the stock closes above the short strike at expiry.
To execute a bull put spread an investor would sell an out-of-the-money put and then buy a further out-of-the-money put.
This bull put spread comes from the vertical spread screener on the TSLA page.

This bull put spread trade involves selling the January expiry $410 strike put and buying the $400 strike put.
Selling this spread results in a credit of around $1.35 or $135 per contract. That is also the maximum possible gain on the trade. The maximum potential loss can be calculated by taking the spread width, less the premium received and multiplying by 100. That give us:
10 – 1.35 x 100 = $865.
If we take the maximum gain divided by the maximum loss, we see the trade has a return potential of 15.61%.
The loss probability is 17.0%, although this is just an estimate.
The Barchart Technical Opinion rating is a 100% Buy with a Average short term outlook on maintaining the current direction.
Long term indicators fully support a continuation of the trend.
Apple Bull Put Spread
For Apple, let’s also look at the Bull Put Spread results for January.

Let’s use the first line item as an example. This bull put spread trade involves selling the January expiry $265 strike put and buying the $255 strike put.
Selling this spread results in a credit of around $1.74 or $174 per contract. That is also the maximum possible gain on the trade. The maximum potential loss can be calculated by taking the spread width, less the premium received and multiplying by 100. That give us:
10 – 1.74 x 100 = $826.
If we take the maximum gain divided by the maximum loss, we see the trade has a return potential of 21.07%.
The loss probability is 28.8%, although this is just an estimate.
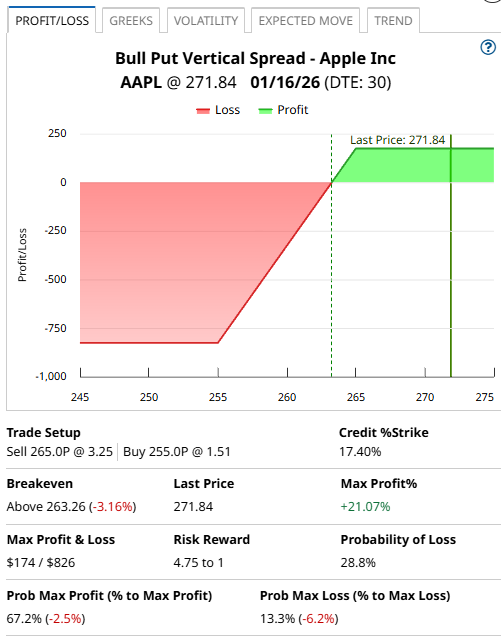
The Barchart Technical Opinion rating is a 80% Buy with a Weakening short term outlook on maintaining the current direction.
Long term indicators fully support a continuation of the trend.
Relative Strength just crossed below 50%. The market is indicating support for a bearish trend.
Conclusion
There you have two bullish trade ideas on two different stocks. Remember to always manage risk and have stop losses in place.
Please remember that options are risky, and investors can lose 100% of their investment. This article is for education purposes only and not a trade recommendation. Remember to always do your own due diligence and consult your financial advisor before making any investment decisions.
On the date of publication, Gavin McMaster did not have (either directly or indirectly) positions in any of the securities mentioned in this article. All information and data in this article is solely for informational purposes. For more information please view the Barchart Disclosure Policy here.
More news from Barchart


