For years, investors have been, to use an old-fashioned phrase, in the chips. And very into chip stocks. That’s been reflected by the outstanding long-term performance of ETFs that track the semiconductor sector, such as the $35 billion VanEck Semiconductor ETF (SMH).
It was one of the first to track this key sub-sector of technology, debuting back in 2011. That was well before artificial intelligence was running the show. But that’s simply the most contemporary application of the semiconductor industry, which powered the first personal computers and so much else since.
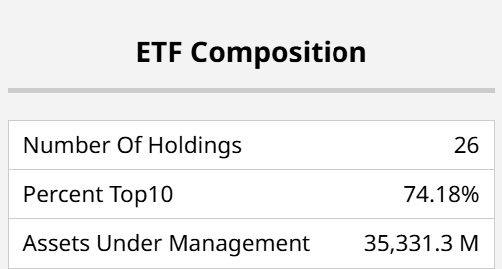
SMH is structured with just over two dozen stocks, and nearly three-fourths of the portfolio comprises just 10 of those names. That means that if SMH is falling hard, it is not difficult to find the culprits.
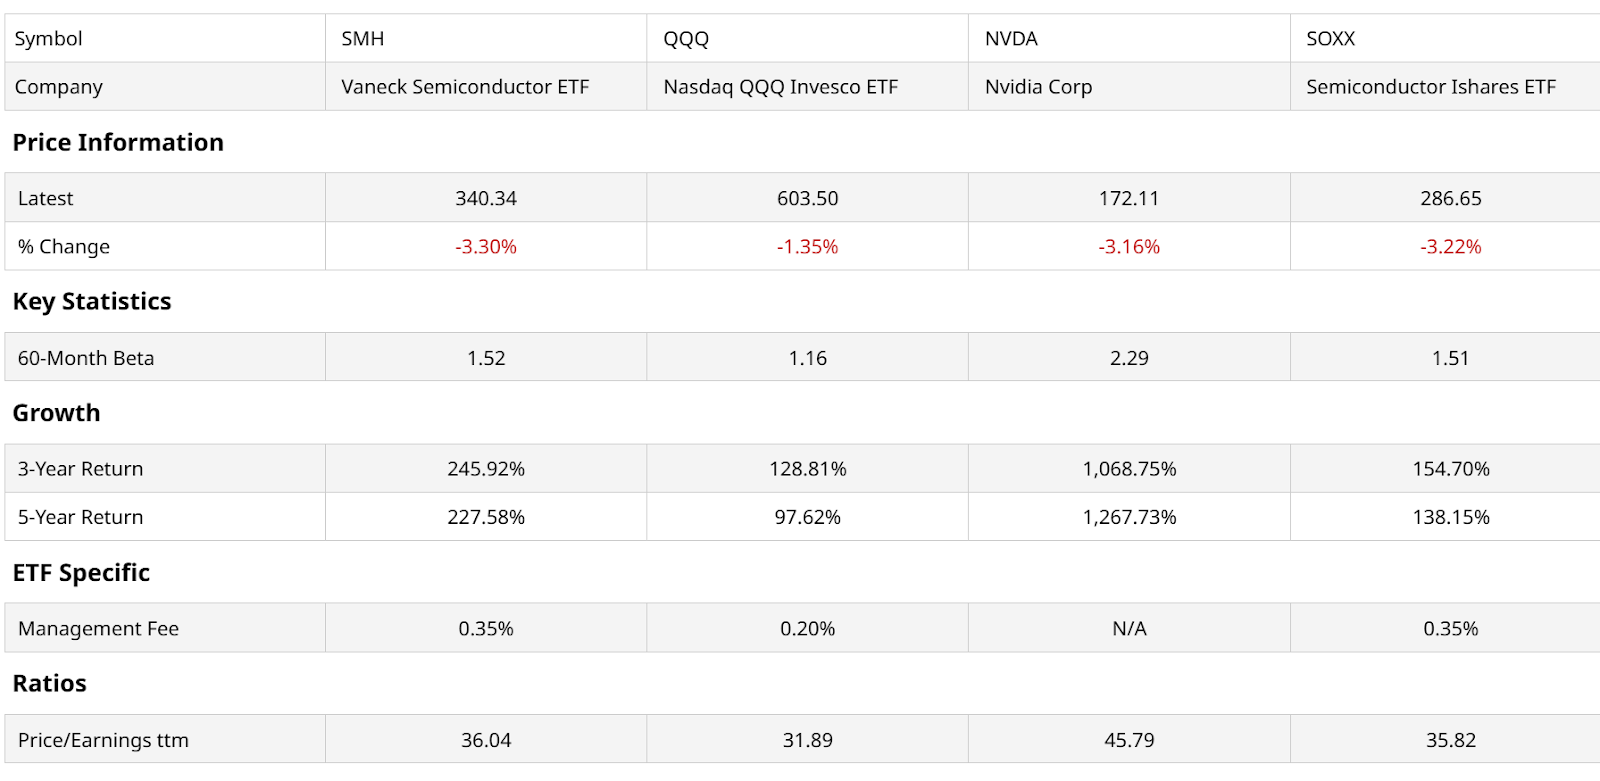
SMH is under fire recently, after years of being on fire, performance-wise. In that regard, it has been much of the fuel that has led the Nasdaq-100 Index ($IUXX) higher. And it is distinguishable from another big semiconductor ETF, the $15 billion iShares Semiconductor ETF (SOXX), in that it is more concentrated. That has allowed SMH to outperform as stocks like Nvidia (NVDA), which pace the sector size-wise, have such explosive gains.
The bull case for SMH is straightforward. Semiconductors power AI, and AI is going to change our lives. However, it is not that simple.
The bear case is multi-pronged at this state of the AI frenzy. Valuations are high, unless lofty expectations are met. And, met soon enough. The internet was like this too. The ultimate outcome was dramatic and life-enhancing. But it didn’t happen fast enough to prevent a bubble from forming, and later popping during the year 2000.
Another risk stems from the nature of this industry. We see a beta of more than 1.50, which means that during this decade, SMH has been 50% more volatile than the S&P 500 Index ($SPX). That worked nicely on the way up, but can have the same impact on the way down, such that a 10% market decline could easily spill SMH by 15% or more.
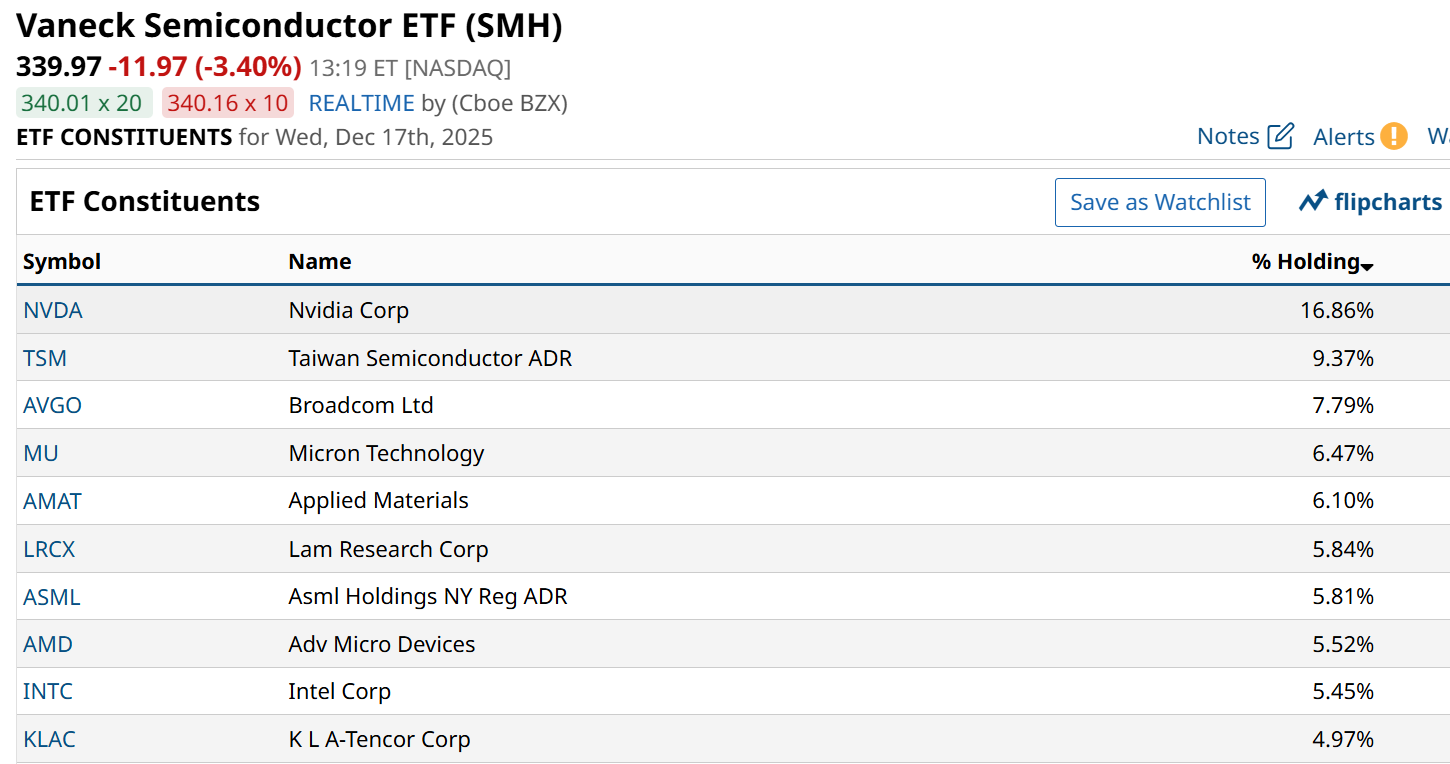
Here’s the current stock roster for SMH. NVDA is about one-sixth of the entire portfolio, and four more stocks combine to account for nearly one-half of the ETF’s total portfolio. So if those stocks melt down, SMH’s other 20 holdings will not likely fill the gap.
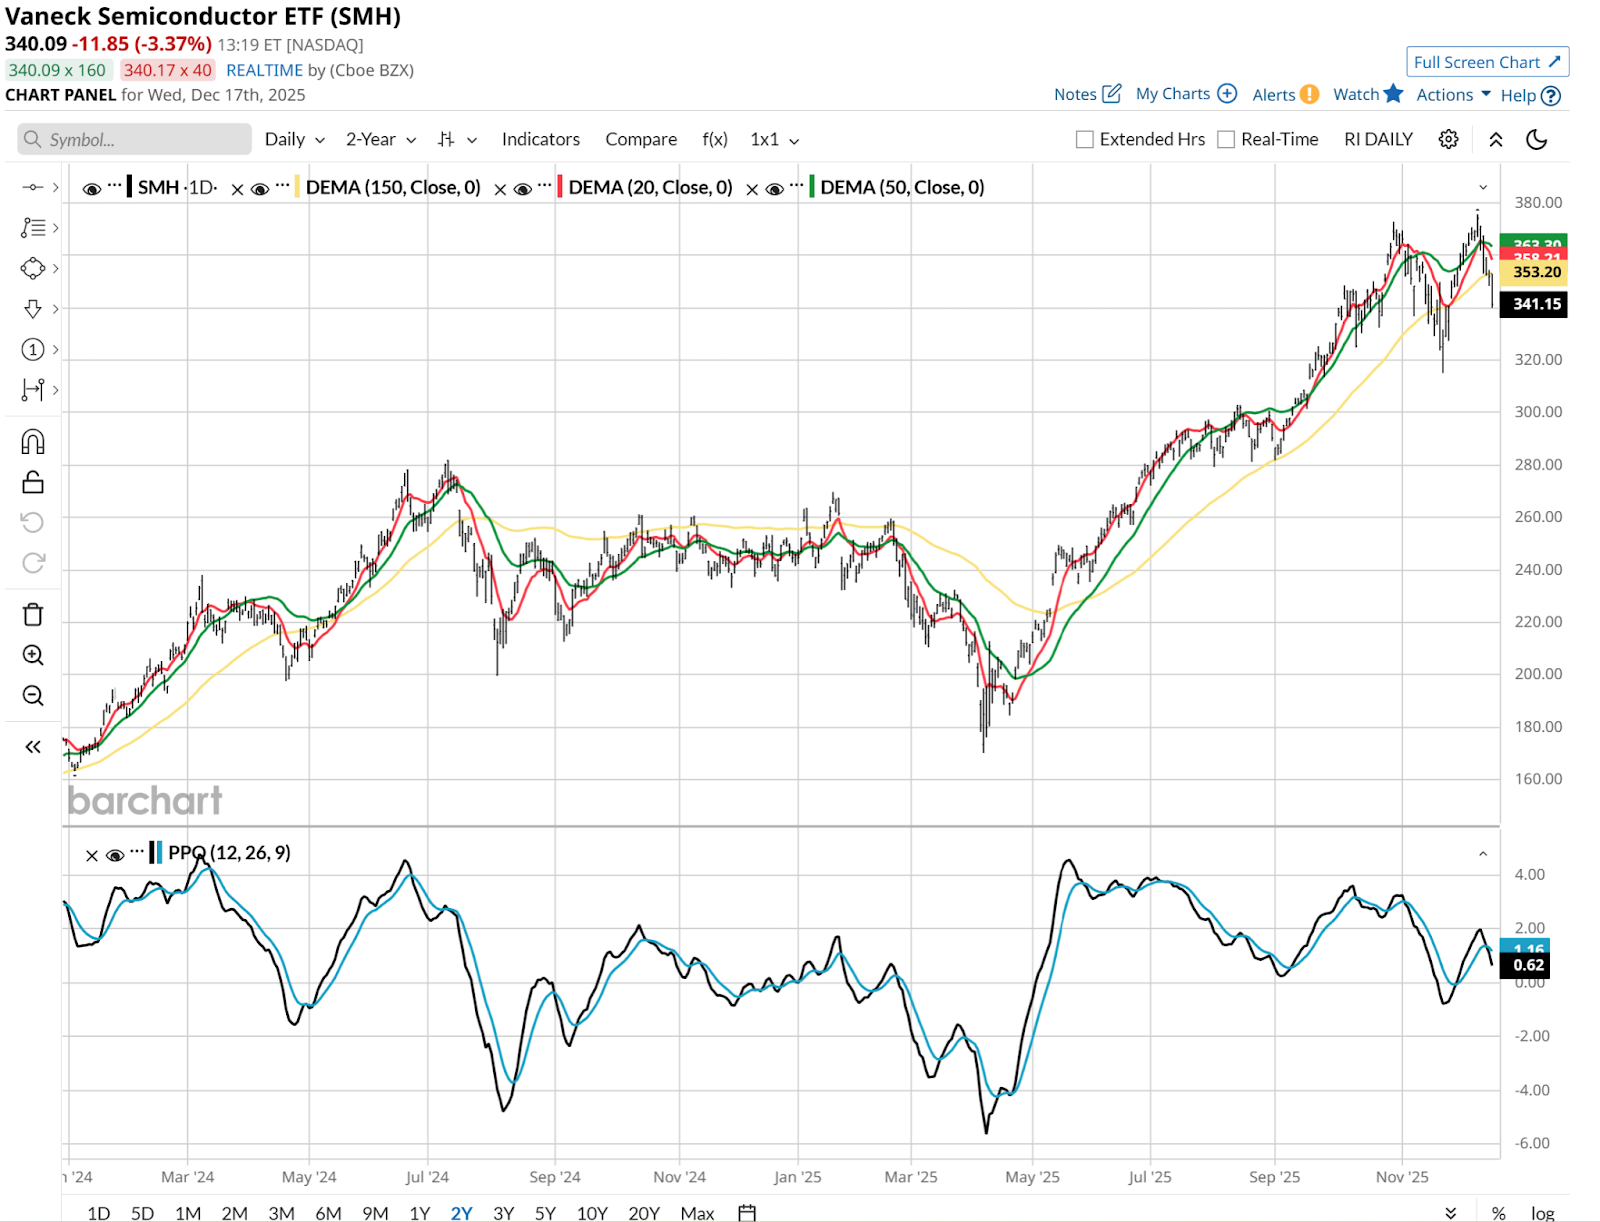
SMH: Charts Flash Bearish Signals
After a move like SMH has had, more than doubled since April’s low, a pullback could be a dip to buy. But it could be much more dangerous.
I am not the type of technician that runs around calling everything a “head and shoulders forming” situation, referring to perhaps the most well-known technical pattern. But here, it seems to fit. The question is whether there will be follow-through to the downside beyond this first 10% dip. The Percentage Price Oscillator (PPO) indicator at bottom is certainly showing a “lower lows and lower highs” picture. This bears watching, literally.
We will know a lot more about the sustainability of this move when the weekly chart is more tenured. It is not yet reflecting much in terms of SMH rolling over. But it could be within days. The 20-week moving average in red on top is the first signal to watch. If it completes its change in direction (down, after being up continuously since May), it will get interesting for bears looking for a long-term reversal. And for traders, it is already getting interesting. The weekly PPO looks threatening to me as well.
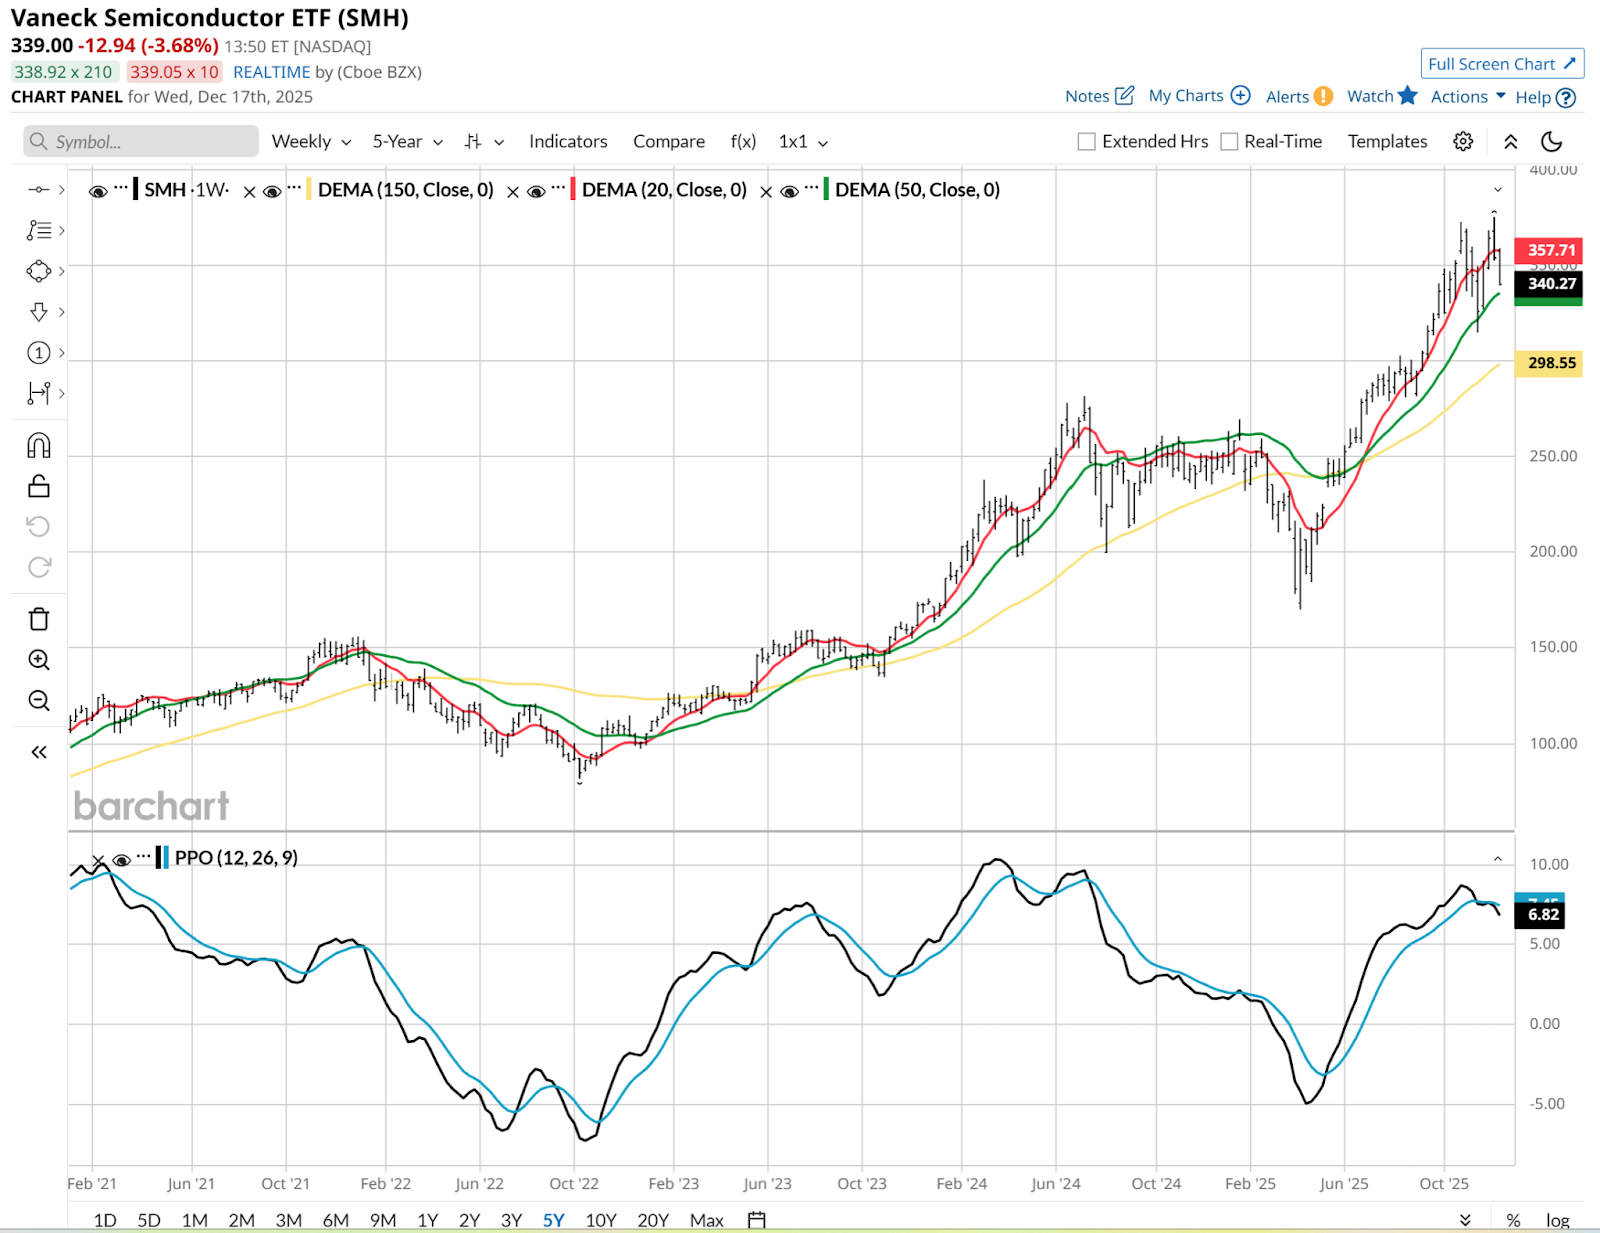
Some will tell you that as NVDA goes, so goes the stock market. When it comes to SMH, that is much more accurate. That’s what happens when we look just a bit below the surface and discover that this section of the technology sector is perhaps the epicenter of what’s holding the whole S&P 500 Index up. Stay tuned, and learn how to be a risk manager.
Rob Isbitts, founder of Sungarden Investment Publishing, is a semi-retired chief investment officer, whose current research is found here at Barchart, and at his ETF Yourself subscription service on Substack. To copy-trade Rob’s portfolios, check out the new Pi Trade app.
On the date of publication, Rob Isbitts did not have (either directly or indirectly) positions in any of the securities mentioned in this article. All information and data in this article is solely for informational purposes. For more information please view the Barchart Disclosure Policy here.
More news from Barchart
- Chip Stocks Are No Longer an Automatic Path to Profits. What the Numbers Say About This Key Semi ETF Now.
- Silver Prices Are Spiking. Here’s Why It Could Be a Buying Opportunity for Gold.
- Why Short–Term Bond ETFs Might Be the Best Income Investment for 2026
- Doctor Copper Needs a Collar: Why Copper’s Surge Might Not Last, and How to Hedge It


