I asked if copper was setting a base for a new high in a November 18, 2025, Barchart article, where I concluded with the following:
I expect copper prices to continue their upward trajectory as technical and fundamental factors support the red nonferrous metal. However, long copper exposure through the CPER ETF during price corrections has been optimal, and that trend is likely to continue. At around the $5 per pound level in November 2025, copper futures could be setting a base for even higher highs in 2026.
Don’t Miss a Day: From crude oil to coffee, sign up free for Barchart’s best-in-class commodity analysis.
Nearby COMEX copper futures were trading at $5.016 per pound on November 17, while the three-month LME forward was at $10,852 per metric ton. In mid-December 2025, the futures were over $5.40 per pound, with the LME forwards above $11,590 per ton.
Tariffs increased copper volatility in 2025
Tariffs are trade barriers that can cause significant price distortions in commodities located in different regions. In early April 2025, the Trump administration’s unprecedented “Liberation Day” tariff announcement caused extreme market volatility across all asset classes, and copper was no exception. While COMEX copper futures rose to new record highs in anticipation of tariffs, LME three-month copper forwards remained well below the 2024 all-time price peak. The price differential between copper in the United States in COMEX warehouses and the red metal stored in London Metal Exchange warehouses moved to a historical high, with the U.S. copper at a significant premium to the LME forwards. Copper stocks moved from LME to COMEX warehouses. COMEX stocks at 93,161 tons at the end of 2024 moved 388% higher to 454,638 tons as of December 8, 2025. Meanwhile, LME copper inventories moved 38.6% lower from 271,400 tons at the end of 2024 to 166,600 metric tons on December 8, 2025.
The LME forwards caught up with the COMEX futures- A bullish sign
U.S. tariffs caused price distortions, leading COMEX copper futures to reach new record highs in March and July 2025 at $5.3740 and $5.9585 per pound, respectively.
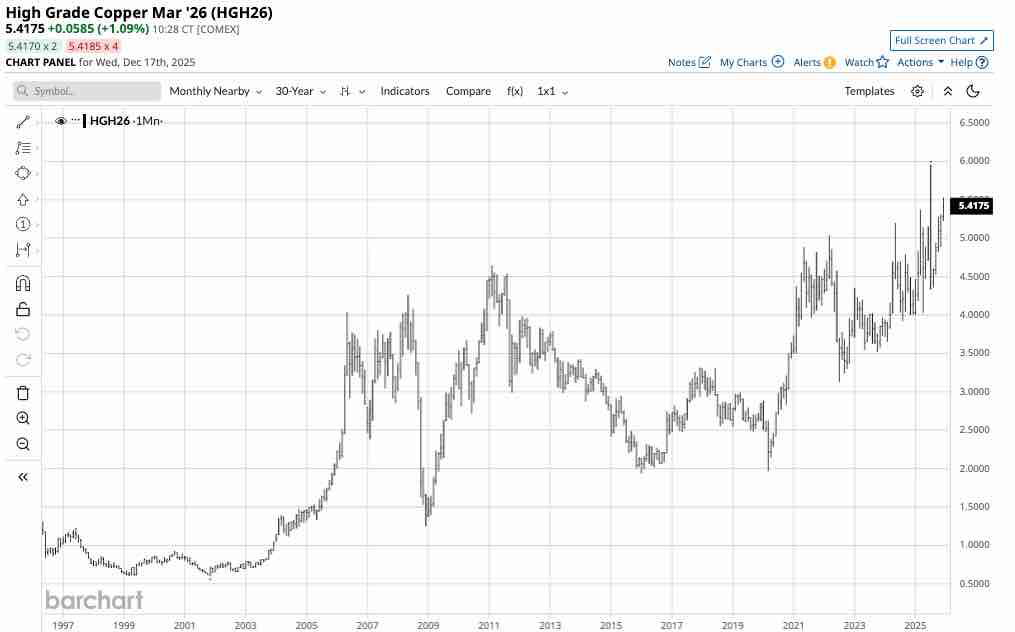
The 30-year monthly COMEX copper futures chart highlights copper’s ascent to two new record peaks in 2025.
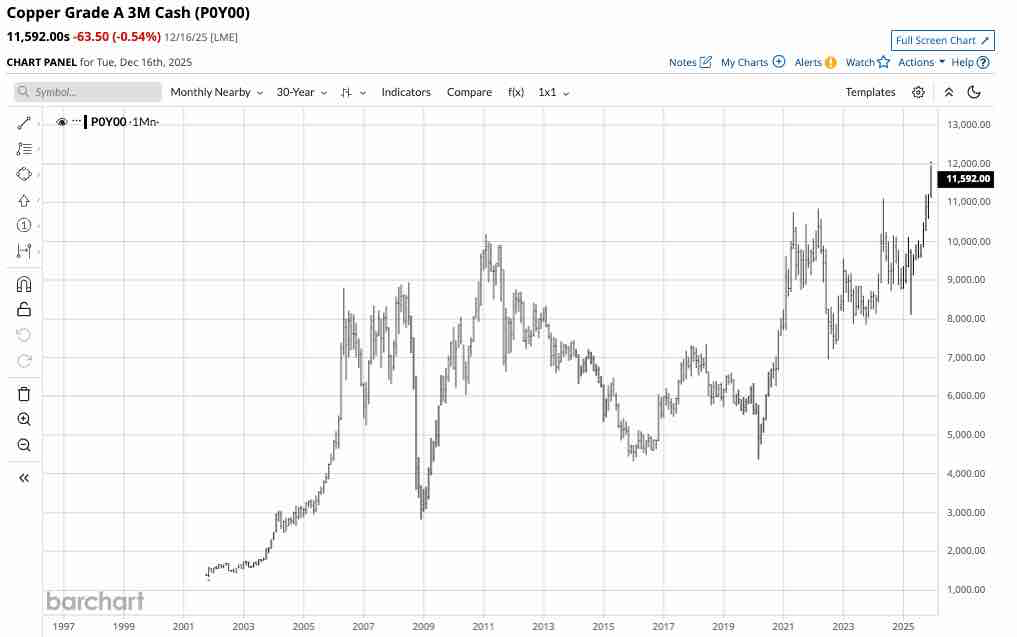
Meanwhile, the 30-year three-month LME copper forward chart shows that LME copper forwards remained below the 2024 record high of $11,104.50 per ton until October 2025, and rose to a new high of $11,952 in December 2025. While the tariffs depressed LME versus COMEX copper prices earlier in 2025, the LME forwards have caught up with the COMEX futures, validating the red metal’s overall bullish technical and fundamental position.
The bullish trend is now a quarter-of-a-century old and continues
While the 30-year charts highlight copper’s bullish trend, the long-term quarterly COMEX futures chart shows copper’s ascent and the bullish path of least resistance.
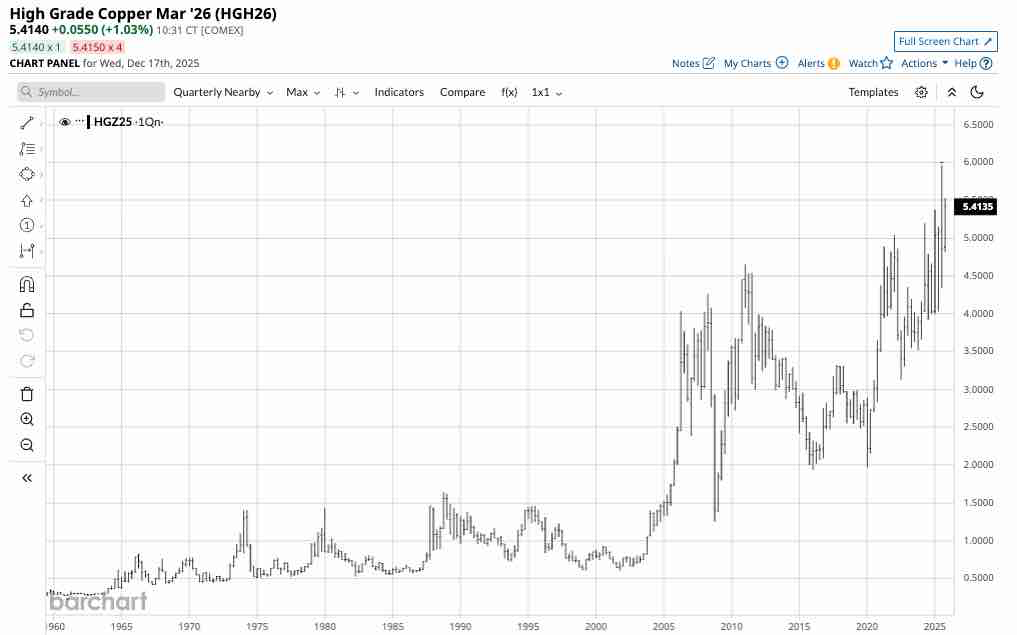
The quarterly chart dating back sixty-six years to 1959 shows that copper has been in a bullish trend since the 2001 low of 60.40 cents per pound. Meanwhile, the pattern of higher lows in 2008, 2016, 2020, 2022, 2023, 2024, and 2025 never violated the previous low, which is a very bullish technical trading pattern.
Fundamentals agree with the bullish technicals
Copper has long been a critical metal for infrastructure building. Over the past few years, the red metal’s demand has increased as it is increasingly required for energy applications in electric vehicles, wind turbines, and solar panels, and technology applications in electronics and semiconductor chips.
In a November 28, 2025, report, JP Morgan forecast a 330,000 metric ton copper deficit, with the demand outstripping supplies. When fundamental supply-and-demand analysis aligns with technical analysis, the results can be powerful. Copper’s bullish trend looks likely to continue through 2026, and perhaps longer.
CPER is a copper ETF, while DBB has exposure to copper and other LME base metals
Buying copper on price weakness during price corrections has been optimal since the turn of this century, and I expect that trend to continue in 2026.
The most direct routes for copper exposure are the COMEX futures and the LME forwards. Trading or investing in futures or forwards requires specialized accounts. Meanwhile, the two ETF products with copper exposure are the U.S. Copper ETF (CPER) and the Invesco DB Base Metals Fund (DBB). CPER holds a portfolio of COMEX copper futures, while DBB has exposure to LME copper, aluminum, zinc, nickel, and lead prices.
At $33.19 per share, CPER had nearly $347 million in assets under management. CPER trades an average of over 478,000 shares daily and charges a 0.88% management fee.
At $22.30 per share, DBB had over $141.60 million in assets under management. DBB trades an average of over 220,000 shares daily and charges a 0.77% management fee.
While CPER is a pure play on COMEX copper prices, DBB reflects the price action in copper, along with aluminum, zinc, nickel, and lead. Meanwhile, each base metal has idiosyncratic fundamentals that drive its price higher or lower, but they tend to follow copper prices, as copper is the leader of the LME pack.
The odds favor a continuation of the copper bull market in 2026, but buying on price weakness has been optimal for a quarter of a century. I expect that pattern to continue in 2026 as even the most aggressive bull markets rarely move in straight lines.
On the date of publication, Andrew Hecht did not have (either directly or indirectly) positions in any of the securities mentioned in this article. All information and data in this article is solely for informational purposes. For more information please view the Barchart Disclosure Policy here.
More news from Barchart