Micron Technology (MU) delivered what Morgan Stanley called the best revenue and earnings beat in U.S. semiconductor history outside Nvidia (NVDA). Following its fiscal Q1 earnings, MU stock rose 10% as the memory chipmaker revealed it cannot keep up with surging demand for artificial intelligence. The company's blunt assessment during its earnings call captured the supply-demand imbalance reshaping the memory market: “We are more than sold out.”
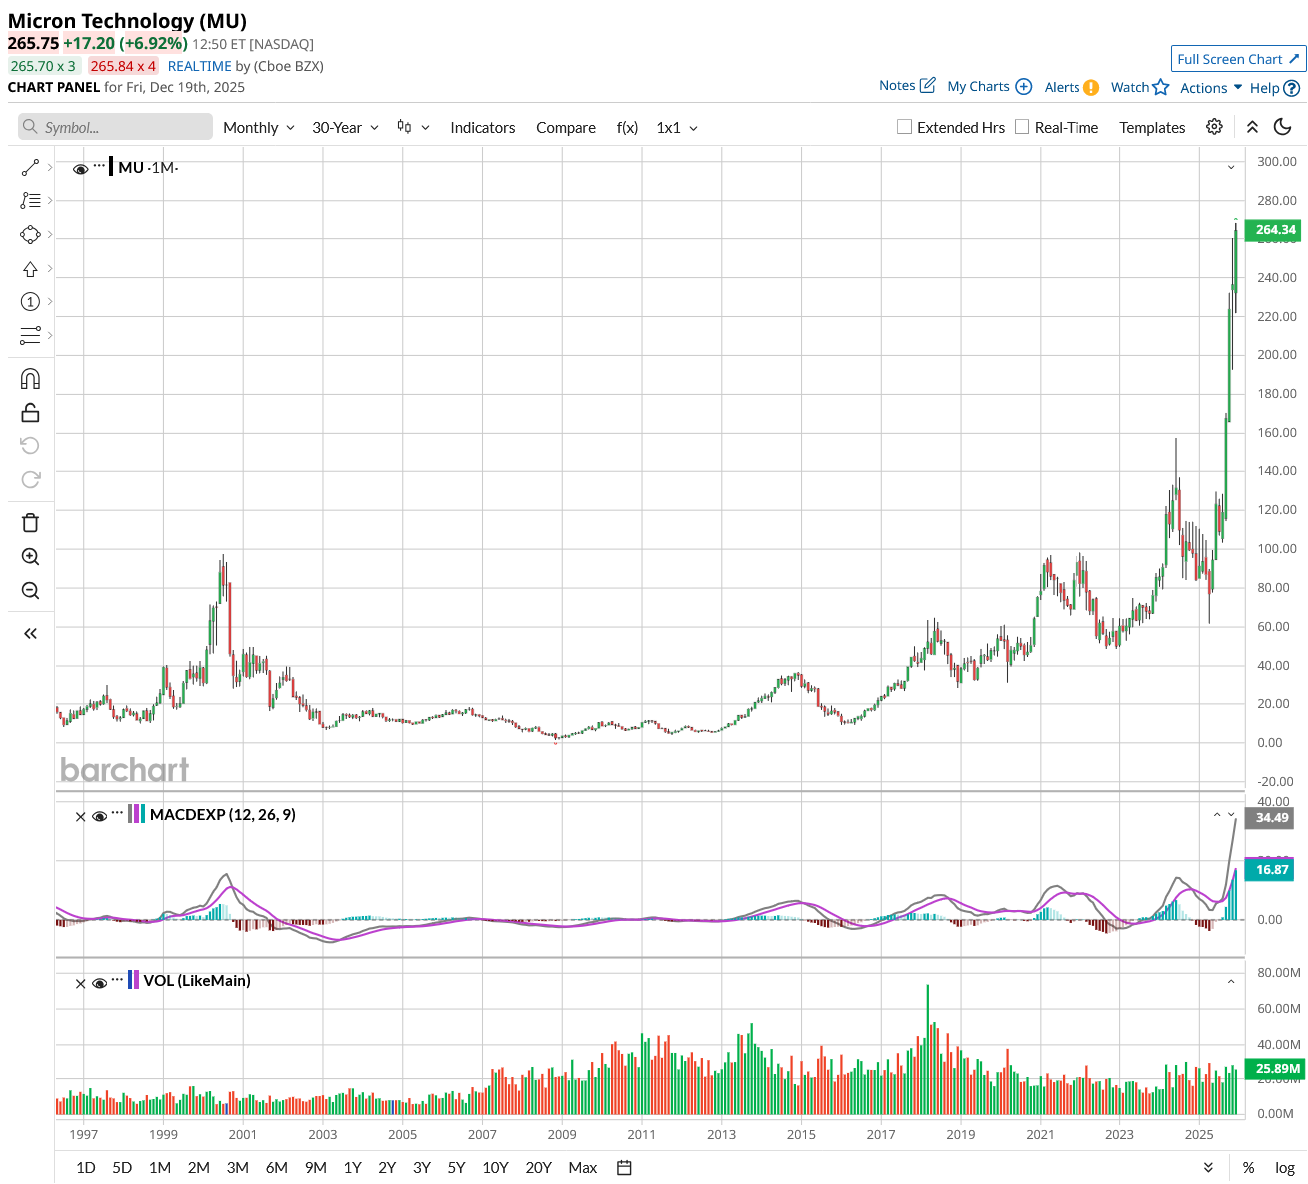
Micron stock is up 200% over the last 12 months and brought investors a return of over 1,655% in the past decade.
Stellar Earnings
In the quarter ended in November, Micron reported revenue of $13.64 billion and adjusted earnings per share of $4.78. Comparatively, Wall Street forecast revenue at $12.84 billion and earnings at $3.95 per share in Q1.
For the current quarter, it forecast revenue of $18.70 billion, which was $4.6 billion higher than consensus estimates. Its projected earnings of $8.42 per share also crushed the $4.78-per-share expectation.
Micron raised its capital expenditure guidance to $20 billion for fiscal 2026, up from $18 billion. It also forecast gross margins of 68%, reflecting the company's pricing power amid robust demand. Notably, it estimates the total addressable market for specialized memory to touch $100 billion by 2028, indicating an annual growth rate of 40%.
Micron’s decision to stop selling memory directly to consumers indicates supply constraints as it redirects all available capacity towards lucrative AI infrastructure customers. Just three companies, including Micron, produce high-bandwidth memory for AI applications. Micron’s pricing power might be similar to what Nvidia enjoyed three years back.
Micron Benefits From the AI Megatrend
Micron emphasized it is unable to satisfy orders for high-bandwidth memory used in AI servers, conventional DRAM for data centers, or NAND flash storage. Management acknowledged they are working to find threshold supply levels for all customers to minimize business disruptions.
Micron's production bottlenecks stem from physical limitations rather than planning failures. The company operates some of the largest and most complex factories on the planet, and meaningful capacity expansion requires greenfield construction that won't materially impact supply until fiscal 2027.
Near-term bit growth depends primarily on node transitions to 1-gamma for DRAM and Generation 9 for NAND, both of which are ramping faster than previous generations. Micron’s cloud memory sales doubled year-over-year (YoY) to $5.28 billion, while data center SSD revenue exceeded $1 billion for the first time.
Micron holds leadership positions in both high-capacity QLC storage and high-performance Generation 6 SSDs, technologies that AI servers require in increasing quantities. The company also faces unexpected demand spillover as customers struggle to source adequate hard disk drives, prompting more buyers to switch to solid-state alternatives.
Management's pricing power appears durable given structural supply constraints. Gross margins reached 68% in the fiscal first quarter and are projected to climb further, albeit at a more gradual pace than recent quarters.
Micron has already secured volume and pricing agreements for 2026 HBM production. These agreements should provide revenue visibility rarely seen in cyclical memory markets. Further, any incremental supply improvements can be placed immediately at favorable terms.
Micron's capital allocation priorities center on capacity expansion while maintaining technology leadership.
It reduced balance-sheet debt by $2.7 billion and repurchased $300 million of MU stock in fiscal Q1. Despite a focus on capex investments, Micron reported a free cash flow margin of 30% in the November quarter.
Is MU Stock Still Undervalued?
Analysts tracking MU stock forecast revenue to increase from $37.38 billion in fiscal 2025 to $84.62 billion in fiscal 2027. In this period, its free cash flow is estimated to grow from $1.67 billion to $22.86 billion. The company’s adjusted earnings are also expected to grow from $8.29 per share in fiscal 2025 to $37 per share in 2027.
Over the last 12 months, MU stock traded at a forward price-to-earnings multiple of 11.6x. At a similar multiple, the chip stock should be priced at $407 in December 2026, indicating an upside potential of 63% from current levels.
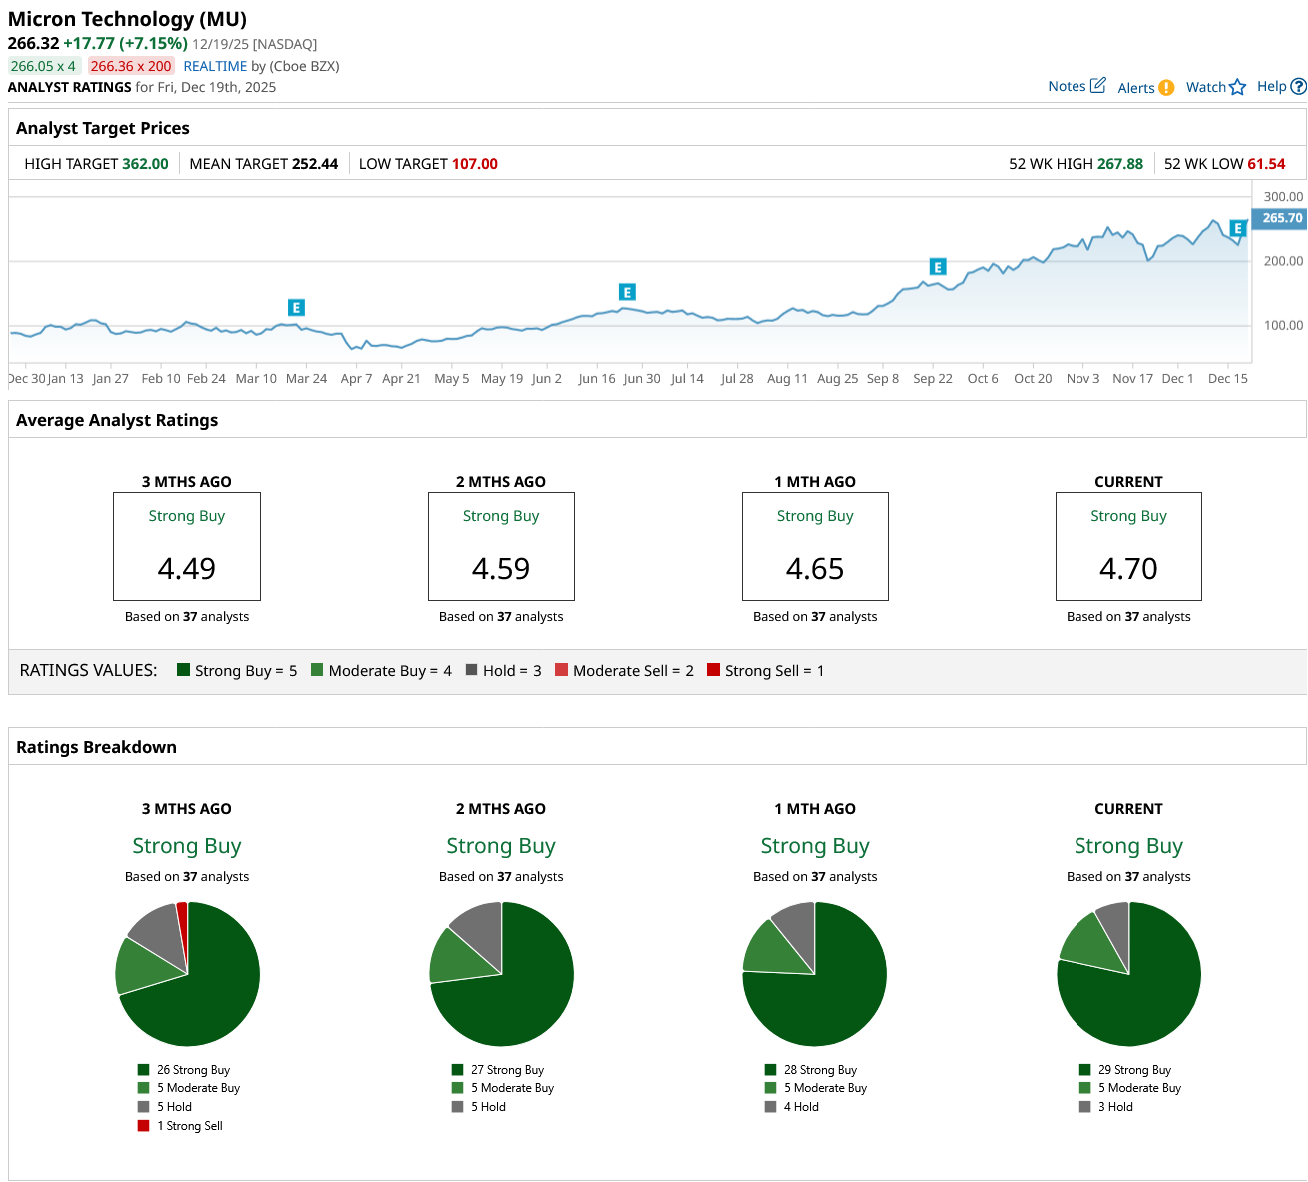
Out of the 37 analysts covering MU stock, 29 recommend “Strong Buy,” five recommend “Moderate Buy,” and three recommend “Hold.” The average MU stock price target is $252.44, below the current price of $266.
On the date of publication, Aditya Raghunath did not have (either directly or indirectly) positions in any of the securities mentioned in this article. All information and data in this article is solely for informational purposes. For more information please view the Barchart Disclosure Policy here.
More news from Barchart
- Netflix Stock Went from Boom to Bust This Year: How to Play the Stock for 2026
- As Intuit Jumps Into Stablecoin Business, Should You Buy, Sell, or Hold INTU Stock?
- ConocoPhillips Stock Still Looks 18% Undervalued - How to Play COP Stock?
- Nike, Tilray, and Palantir: Their Unusually Active Put Options Will Boost Your Wallet After Christmas


