ETFOptimize | High-performance ETF-based Investment Strategies

Quantitative strategies, Wall Street-caliber research, and insightful market analysis since 1998.


ETFOptimize | HOME
Close Window

Is D.R. Horton Stock Underperforming the S&P 500?

D.R. Horton, Inc. (DHI) is a leading U.S. homebuilding company headquartered in Arlington, Texas. The company operates across the United States and builds a wide range of residential properties, including single-family homes, townhomes, duplexes, and attached homes. In addition to home construction, D.R. Horton provides mortgage financing and other services to homebuyers. The company’s current market cap is $46.9 billion.

Companies valued at $10 billion or more are generally considered “large-cap” stocks, and D.R. Horton fits this criterion perfectly, exceeding the mark. D.R. Horton is renowned for being a leading U.S. homebuilder with a wide reach.


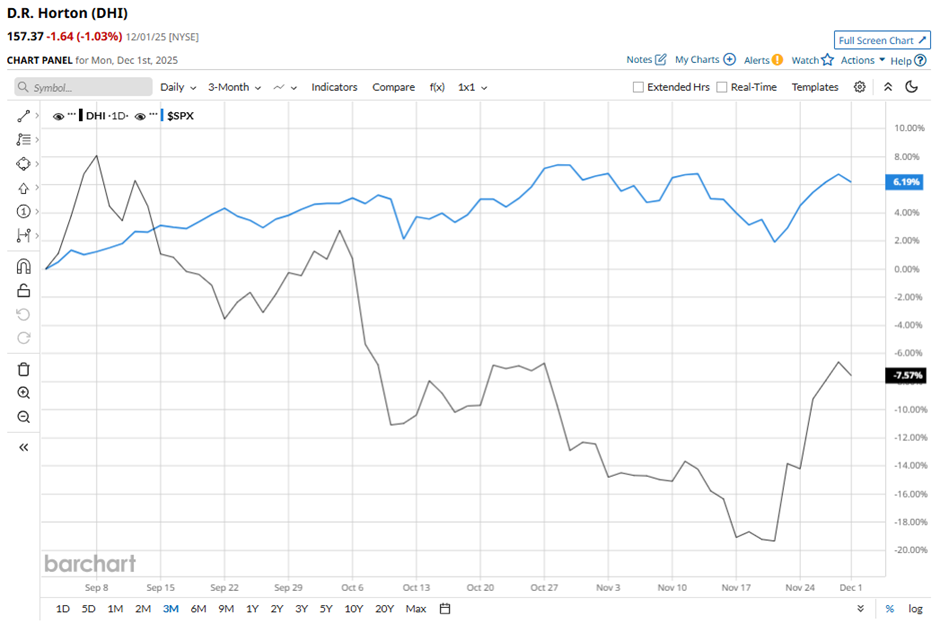
However, the homebuilder stock has fallen 14.7% from its 52-week high of $184.54, achieved on Sept. 8. Shares of DHI declined 7.2% over the past three months, lagging behind the broader S&P 500 Index’s ($SPX5.5% increase during the same time frame.

www.barchart.com

In the longer term, DHI is up 12.6% on a YTD basis, compared to SPX’s 15.8% gains. However, DHI stock has slumped 6.8% over the past 52 weeks, significantly underperforming the SPX’s 12.9% returns over the same time frame.

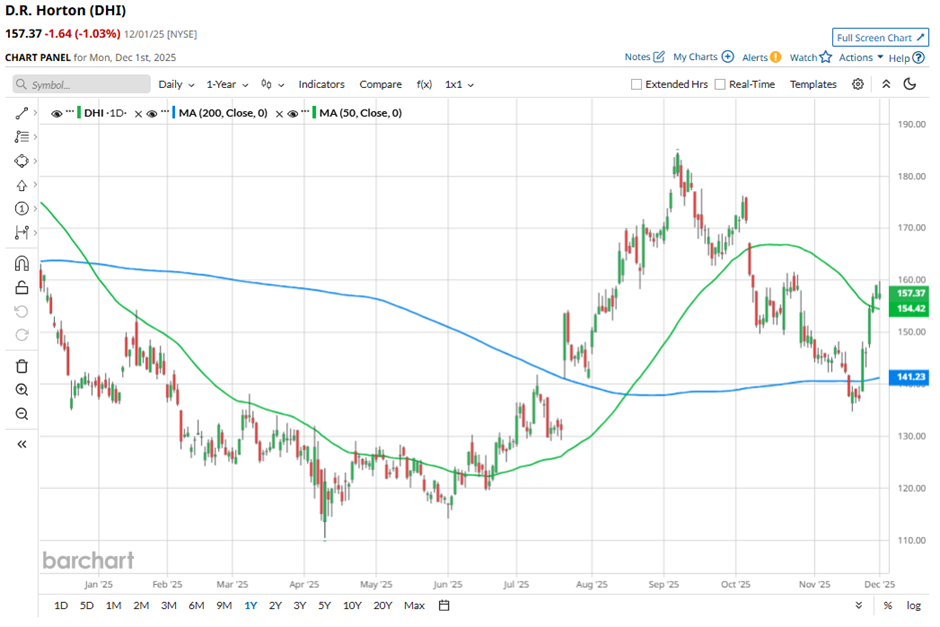
DHI stock has been trading above the 200-day moving average since late July, with some fluctuations lately. However, the stock has been trading below the 50-day moving average since early October.

www.barchart.com

D.R. Horton’s share price has come under pressure due to a weakening U.S. housing market, as demand for new homes has softened with high mortgage rates and affordability concerns discouraging many buyers. Also, people are becoming reluctant amid worries about the economy and their jobs, and margins are affected amid rising costs, combined with increased sales incentives and lower average selling prices.  

In the competitive space, rival Lennar Corporation (LEN) has declined 25.3% over the past 52 weeks and 4.5% on a YTD basis, lagging behind DHI. 

Analysts remain cautiously optimistic about its prospects. The stock has a consensus rating of “Moderate Buy” from the 21 analysts covering the stock, and the mean price target of $164.38 suggests a premium of only 4.5% to current levels.


On the date of publication, Subhasree Kar did not have (either directly or indirectly) positions in any of the securities mentioned in this article. All information and data in this article is solely for informational purposes. For more information please view the Barchart Disclosure Policy here.


More news from Barchart

Recent Quotes

View More
Symbol Price Change (%)
AMZN  229.53
+0.42 (0.18%)
AAPL  278.78
-1.92 (-0.68%)
AMD  217.97
+1.99 (0.92%)
BAC  53.95
+0.07 (0.13%)
GOOG  322.09
+3.70 (1.16%)
META  673.42
+11.89 (1.80%)
MSFT  483.16
+2.32 (0.48%)
NVDA  182.41
-0.97 (-0.53%)
ORCL  217.58
+3.25 (1.52%)
TSLA  455.00
+0.47 (0.10%)
Stock Quote API & Stock News API supplied by www.cloudquote.io
Quotes delayed at least 20 minutes.
By accessing this page, you agree to the Privacy Policy and Terms Of Service.


IntelligentValue Home
Close Window

DISCLAIMER

All content herein is issued solely for informational purposes and is not to be construed as an offer to sell or the solicitation of an offer to buy, nor should it be interpreted as a recommendation to buy, hold or sell (short or otherwise) any security.  All opinions, analyses, and information included herein are based on sources believed to be reliable, but no representation or warranty of any kind, expressed or implied, is made including but not limited to any representation or warranty concerning accuracy, completeness, correctness, timeliness or appropriateness. We undertake no obligation to update such opinions, analysis or information. You should independently verify all information contained on this website. Some information is based on analysis of past performance or hypothetical performance results, which have inherent limitations. We make no representation that any particular equity or strategy will or is likely to achieve profits or losses similar to those shown. Shareholders, employees, writers, contractors, and affiliates associated with ETFOptimize.com may have ownership positions in the securities that are mentioned. If you are not sure if ETFs, algorithmic investing, or a particular investment is right for you, you are urged to consult with a Registered Investment Advisor (RIA). Neither this website nor anyone associated with producing its content are Registered Investment Advisors, and no attempt is made herein to substitute for personalized, professional investment advice. Neither ETFOptimize.com, Global Alpha Investments, Inc., nor its employees, service providers, associates, or affiliates are responsible for any investment losses you may incur as a result of using the information provided herein. Remember that past investment returns may not be indicative of future returns.

Copyright © 1998-2017 ETFOptimize.com, a publication of Optimized Investments, Inc. All rights reserved.