ETFOptimize | High-performance ETF-based Investment Strategies

Quantitative strategies, Wall Street-caliber research, and insightful market analysis since 1998.


ETFOptimize | HOME
Close Window

Is Hilton Stock Underperforming the Nasdaq?

Hilton Worldwide Holdings Inc. (HLT), headquartered in McLean, Virginia, is a hospitality company that manages, franchises, owns, and leases hotels and resorts. Valued at $66.3 billion by market cap, the company provides hospitality services through various hotel brands, such as Waldorf Astoria, Hilton Hotels & Resorts, Home2 Suites by Hilton, and more, as well as owns over 8,300 properties across 138 countries.

Companies worth $10 billion or more are generally described as “large-cap stocks,” and HLT perfectly fits that description, with its market cap exceeding this mark, underscoring its size, influence, and dominance within the lodging industry. Hilton's diverse brand portfolio, including Hampton and Hilton, demonstrates its robust market presence and a vast room network. The Hilton Honors loyalty program, with 195 million members, drives customer retention and attracts new guests, ensuring steady revenue. With a growth in loyalty program membership, Hilton's customer base and market reach continue to expand.


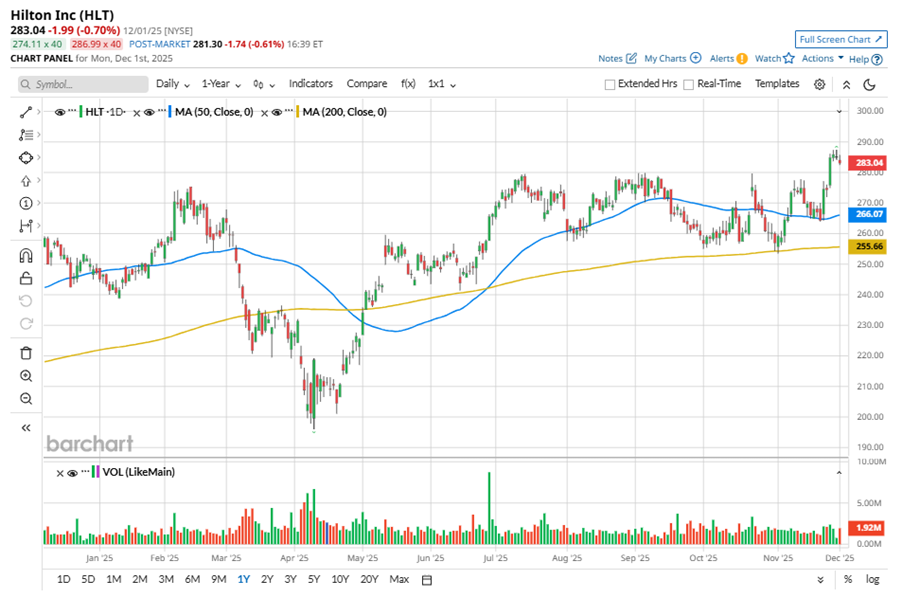
Despite its notable strength, HLT slipped 1.5% from its 52-week high of $287.40, achieved on Nov. 28. Over the past three months, HLT stock has gained 2.5%, underperforming the Nasdaq Composite’s ($NASX8.5% gains during the same time frame.

www.barchart.com

In the longer term, shares of HLT rose 14.5% on a YTD basis and climbed 11.7% over the past 52 weeks, underperforming NASX’s YTD gains of 20.5% and 21.1% returns over the last year.

To confirm the bullish trend, HLT has been trading above its 50-day moving average since early November. The stock has been trading above its 200-day moving average since early May. 

www.barchart.com

On Oct. 22, HLT shares closed up more than 3% after reporting its Q3 results. Its revenue stood at $3.1 billion, up 8.8% year over year. The company’s adjusted EPS came in at $2.11, up 9.9% from the year-ago quarter. 

HLT’s rival, Marriott International, Inc. (MAR) shares have lagged behind the stock, with an 8.8% uptick on a YTD basis and 5% gains over the past 52 weeks.

Wall Street analysts are reasonably bullish on HLT’s prospects. The stock has a consensus “Moderate Buy” rating from the 24 analysts covering it, and the mean price target of $288.75 suggests a potential upside of 2% from current price levels.


On the date of publication, Neha Panjwani did not have (either directly or indirectly) positions in any of the securities mentioned in this article. All information and data in this article is solely for informational purposes. For more information please view the Barchart Disclosure Policy here.


More news from Barchart

Recent Quotes

View More
Symbol Price Change (%)
AMZN  232.38
+0.24 (0.10%)
AAPL  273.81
+1.45 (0.53%)
AMD  215.04
+0.14 (0.07%)
BAC  56.25
+0.28 (0.50%)
GOOG  315.67
-0.01 (-0.00%)
META  667.55
+2.61 (0.39%)
MSFT  488.02
+1.17 (0.24%)
NVDA  188.61
-0.60 (-0.32%)
ORCL  197.49
+2.15 (1.10%)
TSLA  485.40
-0.16 (-0.03%)
Stock Quote API & Stock News API supplied by www.cloudquote.io
Quotes delayed at least 20 minutes.
By accessing this page, you agree to the Privacy Policy and Terms Of Service.


IntelligentValue Home
Close Window

DISCLAIMER

All content herein is issued solely for informational purposes and is not to be construed as an offer to sell or the solicitation of an offer to buy, nor should it be interpreted as a recommendation to buy, hold or sell (short or otherwise) any security.  All opinions, analyses, and information included herein are based on sources believed to be reliable, but no representation or warranty of any kind, expressed or implied, is made including but not limited to any representation or warranty concerning accuracy, completeness, correctness, timeliness or appropriateness. We undertake no obligation to update such opinions, analysis or information. You should independently verify all information contained on this website. Some information is based on analysis of past performance or hypothetical performance results, which have inherent limitations. We make no representation that any particular equity or strategy will or is likely to achieve profits or losses similar to those shown. Shareholders, employees, writers, contractors, and affiliates associated with ETFOptimize.com may have ownership positions in the securities that are mentioned. If you are not sure if ETFs, algorithmic investing, or a particular investment is right for you, you are urged to consult with a Registered Investment Advisor (RIA). Neither this website nor anyone associated with producing its content are Registered Investment Advisors, and no attempt is made herein to substitute for personalized, professional investment advice. Neither ETFOptimize.com, Global Alpha Investments, Inc., nor its employees, service providers, associates, or affiliates are responsible for any investment losses you may incur as a result of using the information provided herein. Remember that past investment returns may not be indicative of future returns.

Copyright © 1998-2017 ETFOptimize.com, a publication of Optimized Investments, Inc. All rights reserved.