Truist Financial Corporation (TFC), headquartered in Charlotte, North Carolina, is a leading financial services provider specializing in banking and trust services. Valued at $59.5 billion by market cap, the company provides a diverse array of services, encompassing retail, small business, and commercial banking, asset management, capital markets, commercial real estate, corporate and institutional banking, insurance, mortgage, payments, and specialized lending and wealth management solutions.
Companies worth $10 billion or more are generally described as “large-cap stocks,” and TFC perfectly fits that description, with its market cap exceeding this mark, underscoring its size, influence, and dominance within the banks - regional industry. TFC’s strong brand and client-first approach have secured its leading market share in high-growth U.S. markets. By prioritizing client needs, TFC fosters loyalty among consumers and small businesses, driving revenue diversification and profitability. Its strategic investments in digital platforms further enhance its competitiveness, meeting evolving client expectations in a digital landscape.
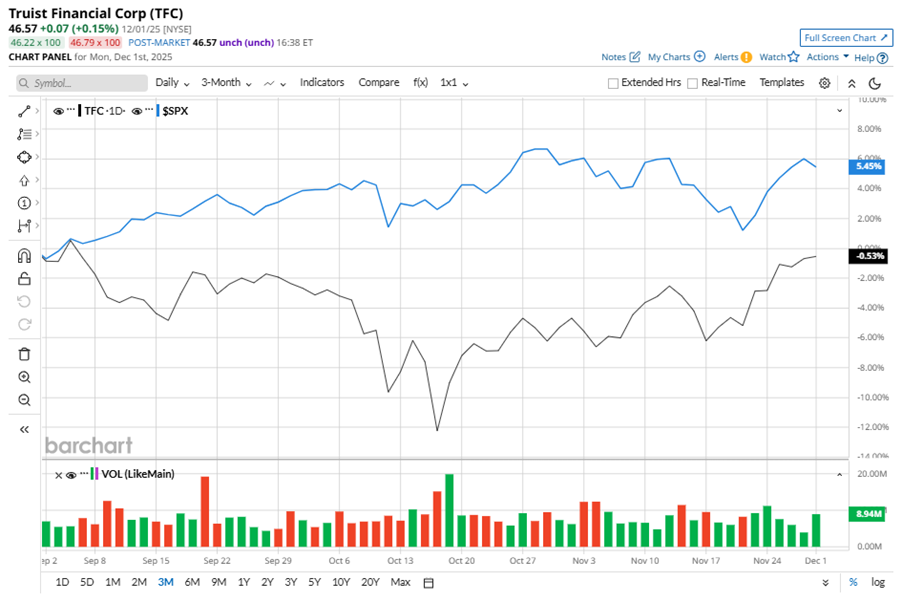
Despite its notable strength, TFC slipped 4% from its 52-week high of $48.53, achieved on Jan. 21. Over the past three months, TFC stock declined marginally, underperforming the S&P 500 Index’s ($SPX) 5.5% gains during the same time frame.
In the longer term, shares of TFC rose 7.4% on a YTD basis but dipped 2.3% over the past 52 weeks, underperforming SPX’s YTD gains of 15.8% and 12.9% returns over the last year.
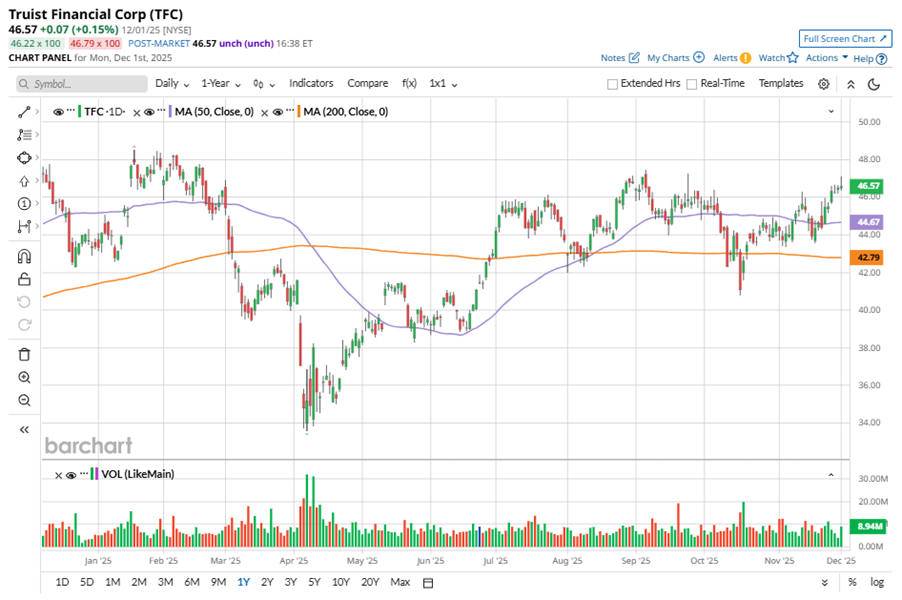
To confirm the bullish trend, TFC has been trading above its 200-day moving average since late June, with slight fluctuations. The stock has been trading above its 50-day moving average since early November, experiencing minor fluctuations.
On Oct. 17, TFC shares closed up by 3.7% after reporting its Q3 results. Its revenue was $5.19 billion, exceeding analyst estimates of $5.15 billion. The company’s adjusted EPS of $1.35 beat analyst estimates by 35.9%.
TFC’s rival, Fifth Third Bancorp (FITB) shares have lagged behind the stock, with a 3.5% uptick on a YTD basis and 8.9% losses over the past 52 weeks.
Wall Street analysts are reasonably bullish on TFC’s prospects. The stock has a consensus “Moderate Buy” rating from the 22 analysts covering it, and the mean price target of $50.74 suggests a potential upside of 9% from current price levels.
On the date of publication, Neha Panjwani did not have (either directly or indirectly) positions in any of the securities mentioned in this article. All information and data in this article is solely for informational purposes. For more information please view the Barchart Disclosure Policy here.
More news from Barchart
- Stock Index Futures Gain as Investors Recover Risk Appetite
- This Options Strategy Turns Your Stock Portfolio Into a Consistent Income Generator
- This ‘Strong Buy’ Dividend Stock Looks Set to Raise Payouts. Should You Buy Shares Now?
- JPMorgan Just Upgraded CleanSpark Stock. Should You Buy Shares Here?


