Valued at a market cap of $41.7 billion, Occidental Petroleum Corporation (OXY) is an energy company that explores and produces oil and natural gas. The Houston, Texas-based company also manufactures basic chemicals used in industrial, consumer, and construction applications.
Companies valued at $10 billion or more are typically classified as “large-cap stocks,” and OXY fits the label perfectly, with its market cap exceeding this threshold, underscoring its size, influence, and dominance within the oil & gas E&P industry. The company is increasingly focused on reducing carbon intensity through Carbon Capture, Utilization, and Storage (CCUS) and other low-carbon initiatives aimed at supporting long-term sustainability in the energy transition.
This energy company has slipped 20.4% from its 52-week high of $53.20, reached on Jan. 13. Shares of OXY have declined 11.1% over the past three months, lagging behind the Energy Select Sector SPDR Fund’s (XLE) 1% rise during the same time frame.
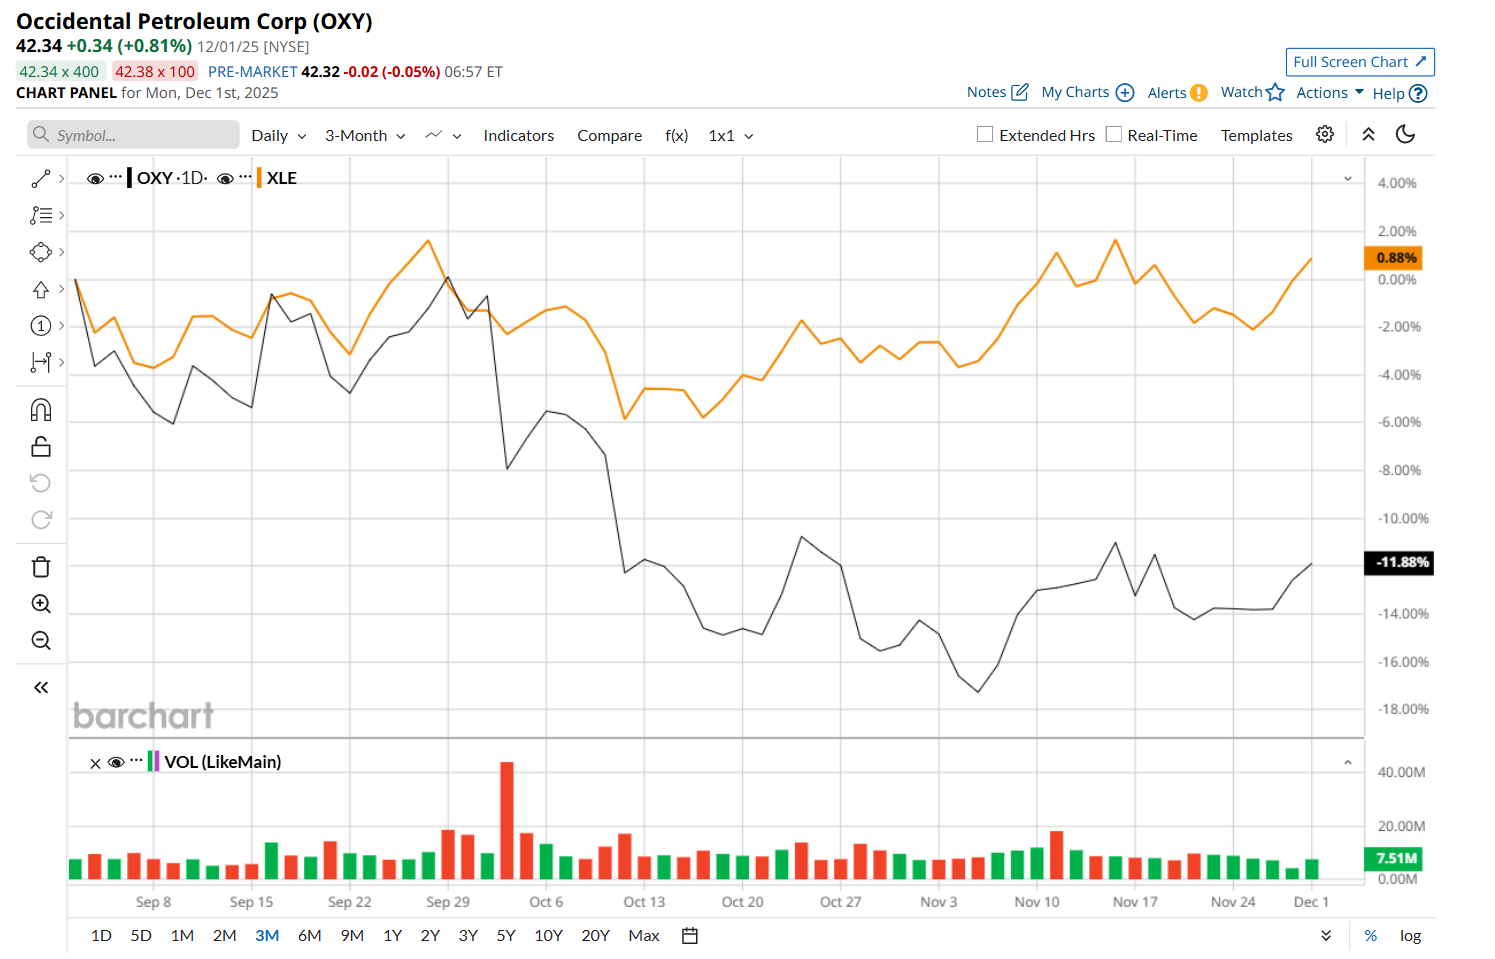
In the longer term, OXY has declined 16.3% over the past 52 weeks, considerably underperforming XLE's 4.4% downtick over the same time period. Moreover, on a YTD basis, shares of OXY are down 14.3%, compared to XLE’s 6.6% return.
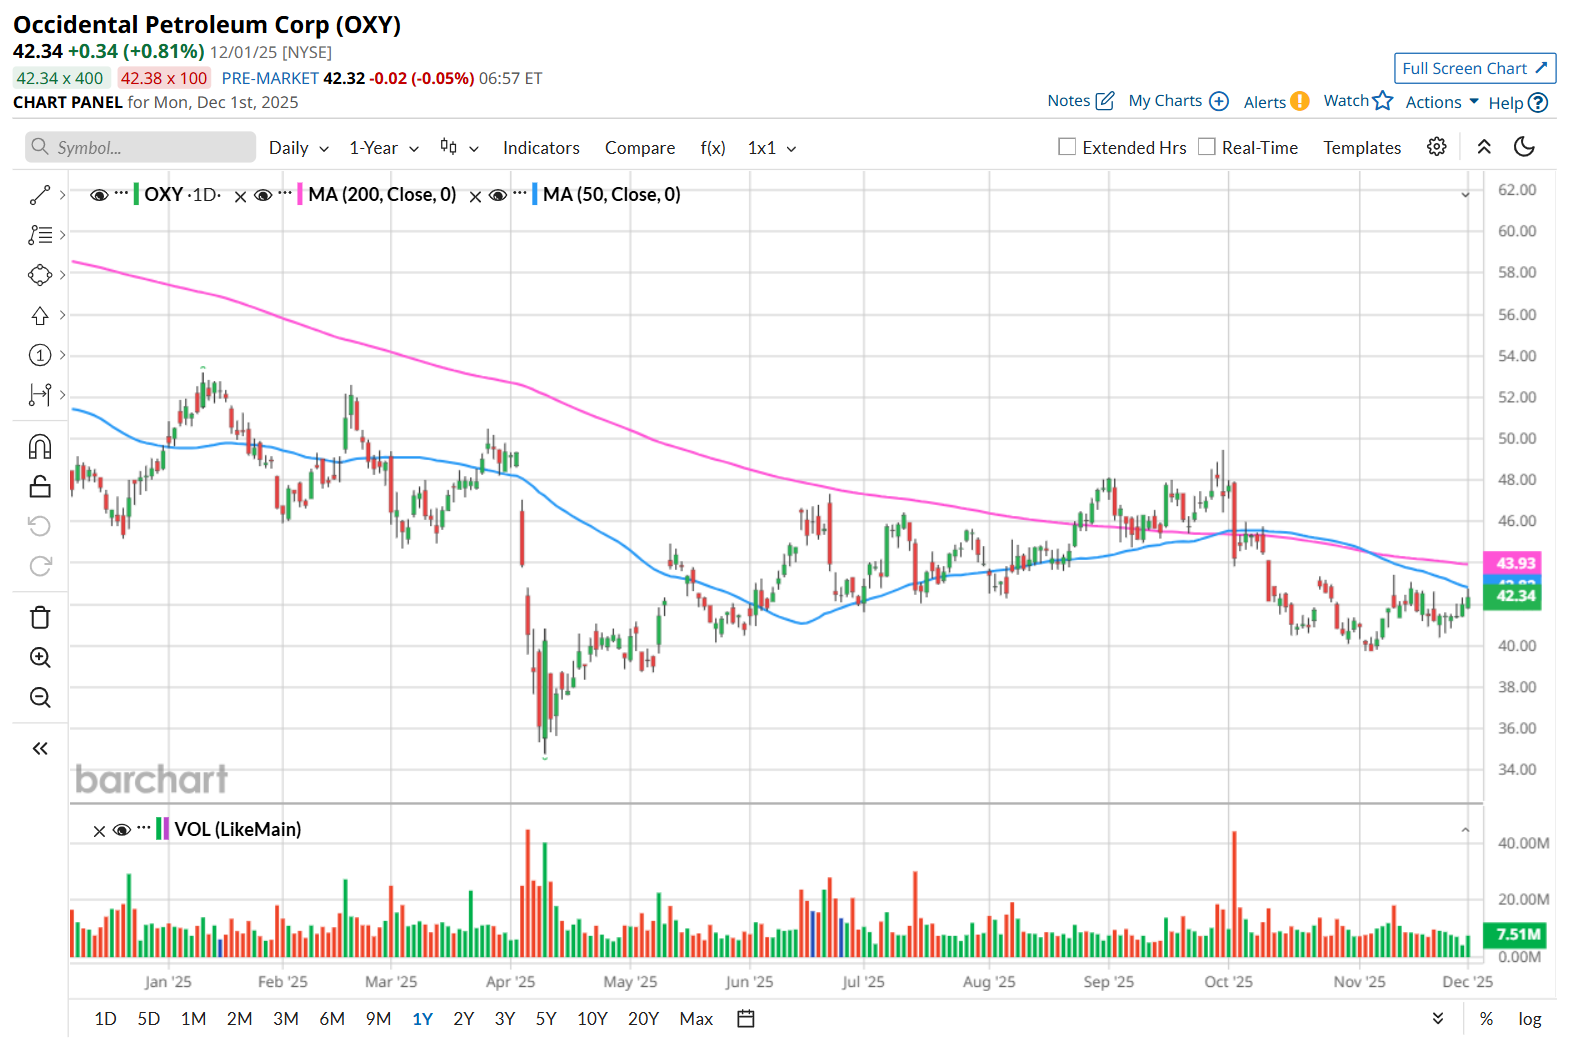
To confirm its bearish trend, OXY has been trading below its 200-day and 50-day moving averages since early October.
On Nov. 10, OXY released its Q3 results, and its shares closed up marginally in the following trading session. The company’s total revenue decreased 6.1% year-over-year to $6.7 billion, but managed to meet analyst expectations. Moreover, as its midstream and marketing segment exceeded the high end of guidance for pre-tax adjusted income, its adjusted EPS of $0.64 handily exceeded consensus estimates of $0.48. However, its bottom line also declined 36% from the same period last year.
OXY has slightly outpaced its rival, ConocoPhillips (COP), which has declined 16.7% over the past 52 weeks. However, it has lagged behind COP’s 9% drop on a YTD basis.
Looking at OXY’s recent underperformance, analysts remain cautious about its prospects. The stock has a consensus rating of "Hold” from the 25 analysts covering it, and the mean price target of $49.80 suggests a 17.6% premium to its current price levels.
On the date of publication, Neharika Jain did not have (either directly or indirectly) positions in any of the securities mentioned in this article. All information and data in this article is solely for informational purposes. For more information please view the Barchart Disclosure Policy here.
More news from Barchart
- JPMorgan Says This Data Center Stock Can Gain Nearly 30% From Here
- This Data Center Stock Could Gain Nearly 195% Over the Next 12 Months. Is It a Buy Here?
- Q4 Seasonality Feels Different. Don’t Miss This Major Overhang for Markets in 2026.
- This Under-$100 Growth Stock Is a Smart Buy With 80% Upside Potential