Based in New Brunswick, New Jersey, Johnson & Johnson (JNJ) is a diversified global healthcare leader. The company develops and markets pharmaceuticals, medical devices, and consumer health products, addressing complex needs across oncology, immunology, surgery, orthopedics, and vision care.
With a market capitalization of nearly $497.2 billion, Johnson & Johnson distributes products through wholesalers, hospitals, retailers, and directly to physicians, nurses, clinics, and eye-care professionals. Attention now centers on its Q4 fiscal 2025 earnings, due Wednesday, Jan. 21, before markets open.
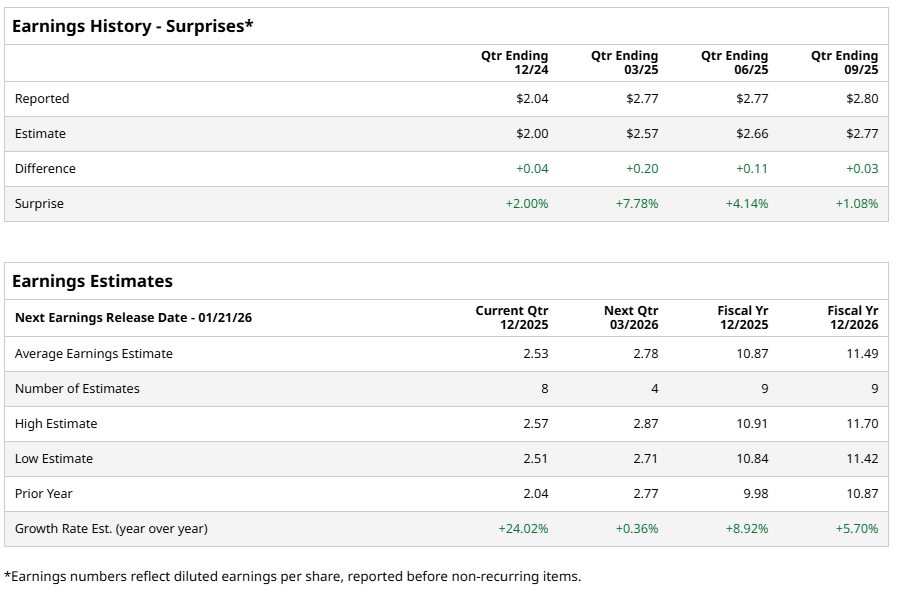
Wall Street expects diluted Q4 EPS of $2.53, reflecting a 24% increase from last year’s $2.04. Moreover, the company has exceeded EPS estimates in each of the past four quarters, demonstrating management's continued ability to translate pipeline strength and operational discipline into steady shareholder value.
Looking back at Q3, Johnson & Johnson delivered a strong performance driven by portfolio depth and pipeline momentum. Revenue rose 6.8% year over year to $23.99 billion, surpassing Street expectations of $23.75 billion.
Adjusted EPS climbed 15.7% year over year to $2.80, topping analyst estimates of $2.77. Management has also raised full-year sales guidance to $93.7 billion, underscoring confidence in sustained growth, particularly from Innovative Medicine and MedTech, which continue to anchor margins and long-term scalability.
Analysts also expect the momentum to continue. Diluted EPS for fiscal 2025 is projected to rise 8.9% year over year to $10.87, followed by a further 5.7% increase to $11.49 in fiscal 2026.
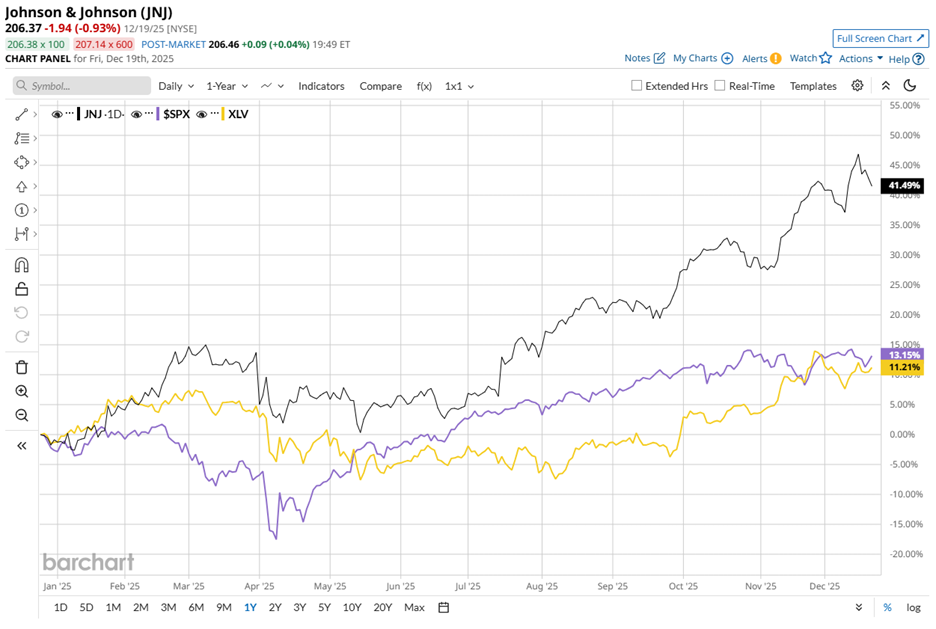
Over the past 52 weeks, JNJ stock surged 43.7%, while year-to-date (YTD) gains reached 42.7%. In comparison, the S&P 500 Index ($SPX) rose 16.5% over the past year and 16.2% YTD, positioning JNJ stock as a pronounced outperformer.
The outperformance becomes more striking against the State Street Health Care Select Sector SPDR ETF (XLV), which jumped 13.7% over the past 52 weeks and 12.6% YTD.
Moreover, Johnson & Johnson recently released Phase 3 MajesTEC-3 data, underscoring the potential of TECVAYLI® combined with DARZALEX FASPRO® as early second-line therapy for relapsed or refractory multiple myeloma.
At nearly three years, results showed an 83% reduction in progression or death risk, leading the stock to climb roughly 3.3% intraday on Dec. 10, a day after the announcement.
Analyst sentiment remains positive, with a consensus rating of “Moderate Buy” holding strong for the past three months. Among 25 analysts, 13 rate JNJ stock a “Strong Buy,” two suggest “Moderate Buy,” and 10 recommend “Hold.”
JNJ’s average price target of $211.12 represents potential upside of 2.3%. Meanwhile, the Street-high target of $240 implies a 16.3% upside.
On the date of publication, Aanchal Sugandh did not have (either directly or indirectly) positions in any of the securities mentioned in this article. All information and data in this article is solely for informational purposes. For more information please view the Barchart Disclosure Policy here.
More news from Barchart
- As Google Launches Gemini 3 Flash, Should You Buy, Sell, or Hold GOOGL Stock?
- Amazon Could Invest $10 Billion in OpenAI. Should You Invest in AMZN Stock First?
- Holiday Trading, Inflation Data and Other Key Things to Watch this Week
- Analysts Are Hot on the Foldable iPhone. Should You Buy AAPL Stock Before Apple’s Next Big Product Launch?