Michael Burry is an investor who isn’t afraid to take a long position, even when it appears to be contrarian to the rest of the market. He was the investor who, starting in 2005, identified the risky nature of the subprime mortgage market. He bet against the market and made millions in selling credit default swaps when the housing bubble popped in 2008. His now-famous bet inspired the movie, “The Big Short,” which went on to win an Academy Award.
Burry recently closed down his hedge fund, Scion Asset Management, which frees him from SEC rules that prevent fund managers from talking about specific stocks. And he’s using his newly found freedom on Substack and his new product, “Cassandra Unchained,” to dole out investing advice and share his unique investing style.
“This is a great time of year to find great companies being sold down too far as a result of window dressing and tax-loss harvesting,” he wrote. “Many managers do not like to show they have owned big losers at the end of the year. I, on the other hand, do not mind at all.”
One of the names on Burry’s list is the beaten-down apparel company, Lululemon Athletica (LULU). Despite being down more than 50% this year, Burry says that LULU stock is “at minimum” a hold for the next three to five years.
About Lululemon Stock
Based in Vancouver, Canada, Lululemon makes athletic apparel that is primarily targeted toward women and girls. Its lineup includes fitness pants, shorts, tops, and jackets for yoga, training, and running. The company also offers men’s clothing, as well as accessories such as yoga mats and instructional DVDs, water bottles, bags, and other equipment. It currently has a market capitalization of $21.6 billion.
As mentioned before, shares are sagging this year, down 52% on a year-to-date basis, which is disappointing considering the S&P 500 Index ($SPX) is up 17%. It also trails the overall consumer discretionary sector, which is up 5% this year.
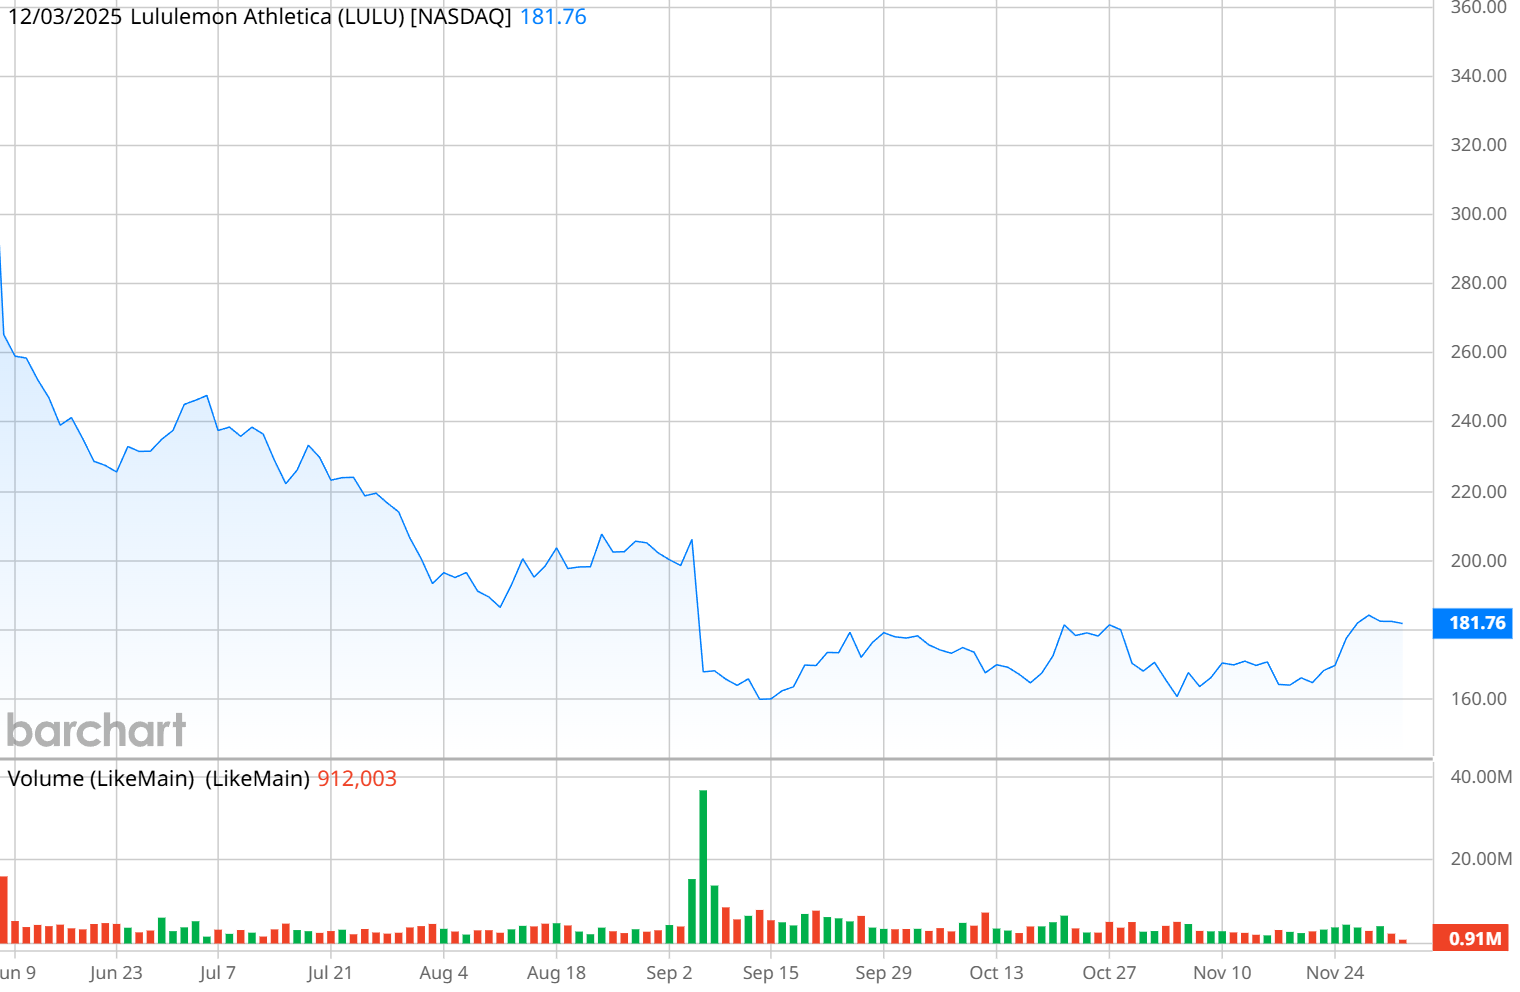
The stock is currently trading at a trailing price-earnings ratio of 12.4x, which is far below its five-year mean of 46.8x. This indicates that LULU stock is exceptionally cheap right now, as the stock price is falling faster than earnings.
Lululemon Beats on Earnings
Lululemon enjoyed a better-than-expected performance for its fiscal second quarter, which ended Aug. 3. Revenue of $2.5 billion was up 6% from a year ago, with the company seeing strong sales from its international segment (up 22%) to offset 1% growth in its Americas segment.
Earnings per share of $3.10 were down $0.05 from a year ago, but still beat analysts’ expectations of $2.84.
“In the second quarter, we exceeded expectations on EPS, but revenue fell short of our guidance, driven predominantly by our U.S. business,” Chief Financial Officer Meghan Frank said. “We are also navigating industry-wide challenges, including higher tariff rates. In light of these dynamics, we are revising our full-year outlook. As we begin the back half of the year, our brand and balance sheet remain strong, and we will continue to exercise financial discipline and strategically invest in our growth potential.”
Q3 guidance calls for revenue between $2.47 billion and $2.5 billion, which would be growth between 3% and 4%. The company is expecting EPS between $2.18 and $2.23 in the quarter. Full-year guidance includes revenue between $10.85 billion and $11 billion, with EPS in a range of $12.77 to $12.97. Management said its guidance reflects a reduction of $240 million in gross profits.
Earnings for the third quarter will be announced after the closing bell on Dec. 11.
What Do Analysts Expect for LULU Stock?
Analysts largely agree with Burry call to hold Lululemon, as the overwhelming sentiment is to hold LULU stock. Of 30 analysts who cover Lululemon, 24 suggest holding; three have “Buy” ratings and three have “Sell” ratings.
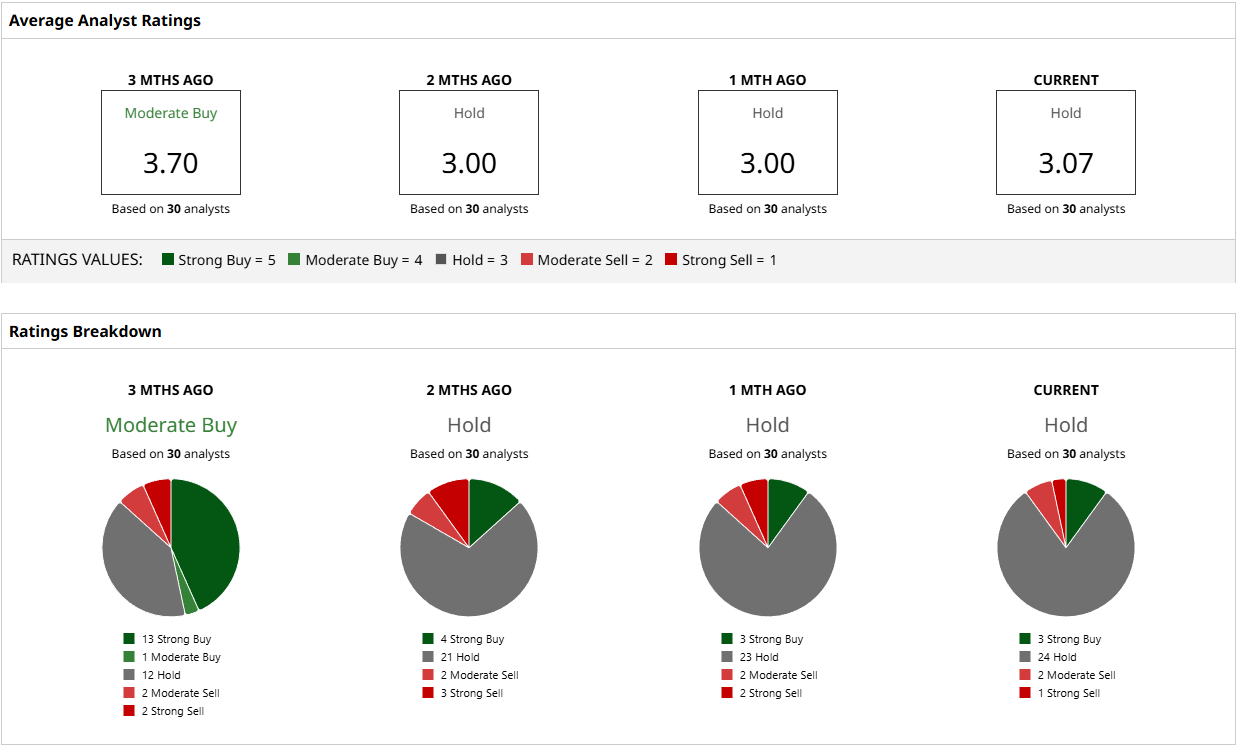
The median price target of $185 is very close to where Lululemon trades now, although a high target of $303 suggests potential upside of 67%. On the other hand, a low target of $120 warns of a 33% decline.
Lululemon has a tough task this year, considering the tariff woes facing the U.S. and Canada, and there doesn’t seem to be any hope of that changing soon. However, as Burry points out, LULU stock is more of a long-term hold, and considering the stock is undervalued today, there seems to be reasonable potential that it will turn around on Burry’s timeline.
On the date of publication, Patrick Sanders did not have (either directly or indirectly) positions in any of the securities mentioned in this article. All information and data in this article is solely for informational purposes. For more information please view the Barchart Disclosure Policy here.
More news from Barchart
- Cathie Wood Is Selling Palantir Stock. Should You?
- Netflix Stock Breaks Below 20-Day Moving Average Amid Selloff. Should You Buy the Dip?
- Michael Burry Says Tesla Is ‘Ridiculously Overvalued.’ Should You Ditch TSLA Stock Here?
- Why Is Michael Burry So Bullish on Lululemon Stock? And Should You Be, Too?