Wednesday’s options trading included 1,222 unusually active options. Topping yesterday’s list was Aloca's (AA) Dec. 12 $40 put with a Vol/OI (volume-to-open-interest) ratio of 93.69. It was one of 13 options with Vol/OI ratios over 25.
Among the 13 were two calls for energy drink maker, Celsius Holdings (CELH). CELH stock is down 29% in the past month since announcing its Q3 2025 financial results. Despite the steep drop over the past month, Celsius’ stock has done well in 2025, up 59% year-to-date.
There appears to be a tug-of-war between bearish and bullish CELH investors right now. Is it a $25, $45, or $65 stock? That’s the million-dollar question.
Whether you’re bearish or bullish, yesterday’s two unusually active call options provide an opportunity.
Here are three ways to play them.
The Options in Question
As I said in the introduction, there were two unusually active call options yesterday with Vol/OI ratios over 25.
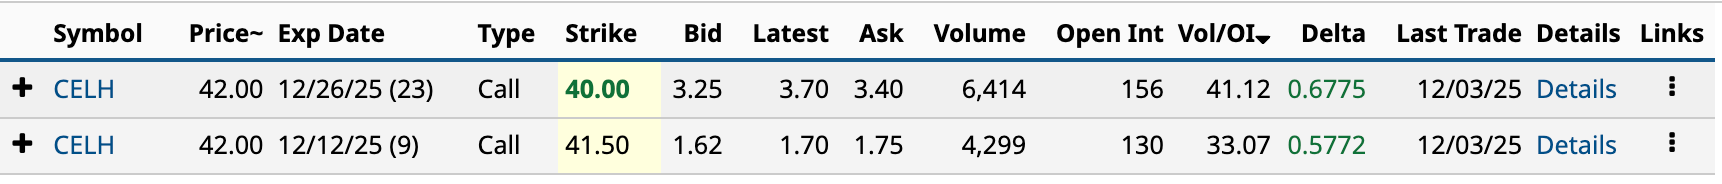
Interestingly, both calls had widespread interest from both small and large investors.
The $41.50 call had trade sizes ranging from 290 (4 of these) to many single-contract transactions. Meanwhile, the $40 call was slightly more focused, with trade sizes ranging from 207 to single-contract transactions, though fewer in total.
Here are three strategies to play these two call options: Bull Call Spread, Bear Call Spread, and Ratio Call Spread.
Bull Call Spread
A bull call spread is when you are moderately bullish about Celsius’ share price rising. Based on yesterday’s closing share price of $42, both calls are ITM (in the money).
This strategy involves buying a call option with a lower strike price and selling a call option with a higher strike price. Both should have the same expiration date.
Unfortunately, these two don’t, so we’ll have to decouple them for this particular play. It’s important to note that a bull call spread uses the premium income from the short call you sell to reduce the cost of the long call you’d buy on its own.
Intuitively, I’d be inclined to go for the bull call spread that has a lower net debit with a reasonably high potential profit.
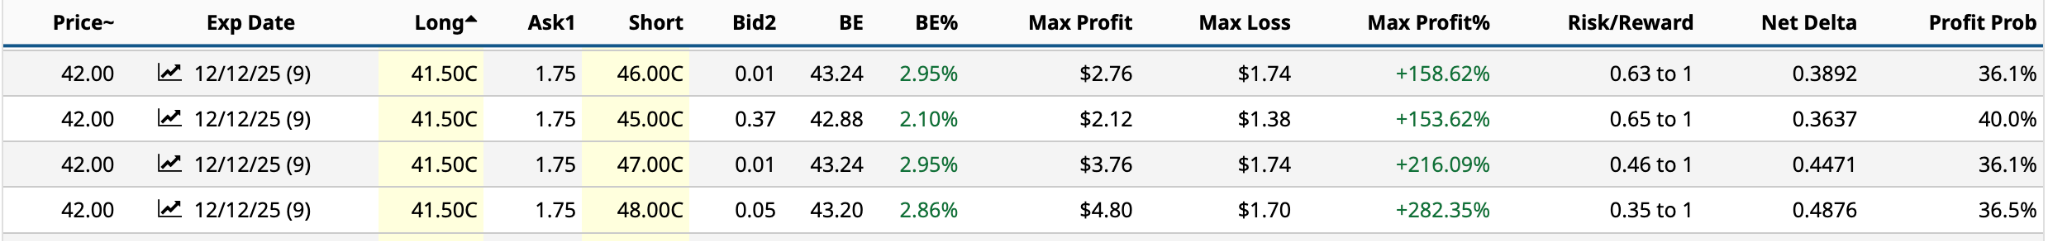
So, in this case, you have two strike prices with the same net debit or maximum loss of $1.74: $46 and $47. The maximum profit for the latter is nearly 60 percentage points higher, yet the risk/reward ratio is lower. That’s an easy call. Of the remaining two, I’d lean toward the $48 strike because the profit potential is nearly double for an additional $32.
If I could only pick one between the $47 and $48 strike, I’d have to go with the latter. The net debit of $170 is $4 less, has a lower risk/reward ratio, and a higher maximum profit, with only a slightly lower profit probability.
Bear Call Spread
The bear call spread is the opposite of the bull spread. Here you are moderately bearish about Celsius’ future share price.
This strategy involves selling a call option with a lower strike price and buying a call option with a higher strike price. Both should have the same expiration date. Like the bull call spread, the bear call spread has both limited profit and loss potential. Further, whereas the bull call spread involved a net debit, the bear call spread generates a net credit.
I used the $41.50 call in the previous example; I’ll use the $40 call expiring on Dec. 26 for this one. Here are two examples: one where the $40 call is short and one where it’s long.
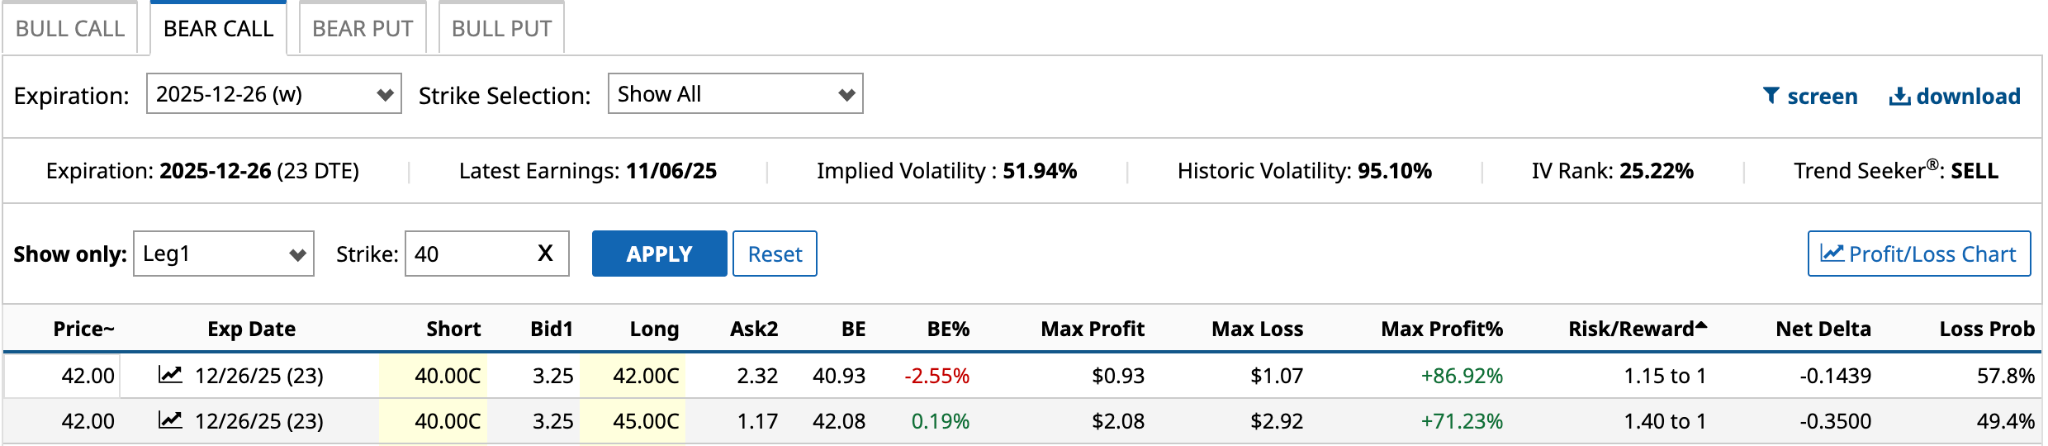
I’ve selected the two long strike prices with the lowest risk/reward ratios. Given the maximum profit percentage, risk/reward ratios, and profit probabilities are pretty close, it becomes a function of comfort and risk tolerance.
The $42 long call strike has a much lower net credit or maximum profit -- $93 compared to $208 for the $45 long call strike -- but its maximum loss of $107 [$42 long call strike - $40 short call strike - $0.93 net credit] is much more palatable than $292 for the higher-priced long call strike.
If it were me, I’d go with the lower maximum profit, but everyone’s different.
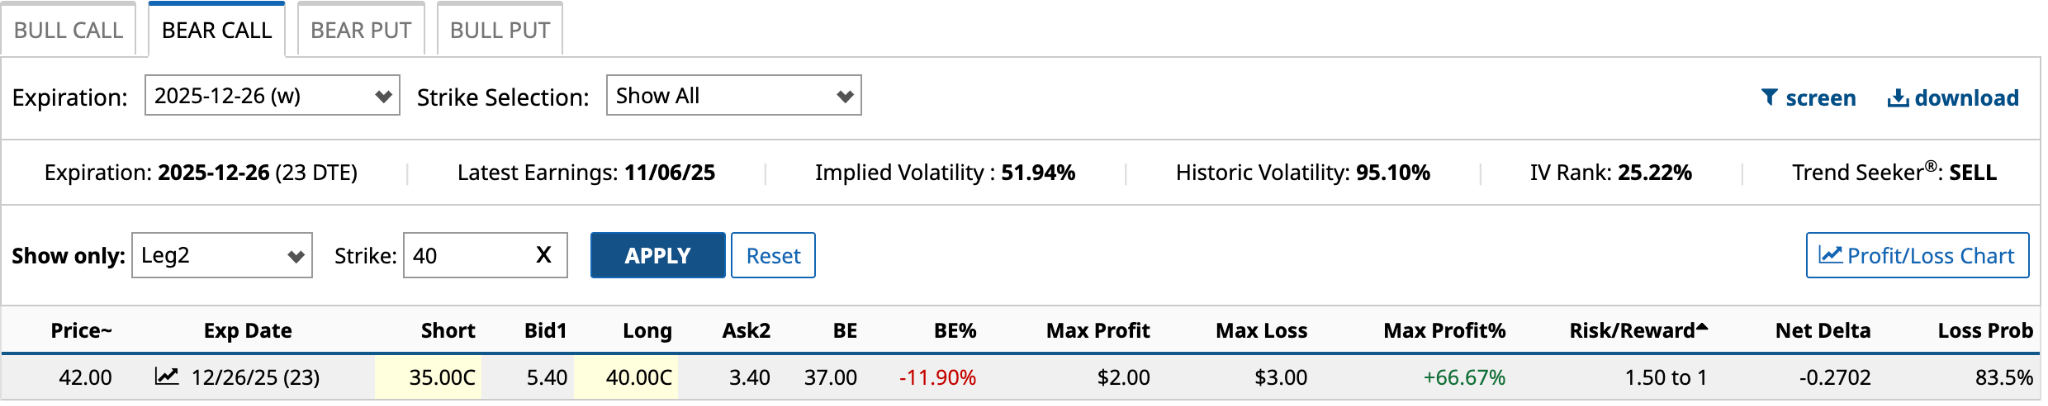
In this example, the $40 call is long, not short. The $35 short call provides $540 in premium income to offset the $340 cost of the $40 long call, for a net credit (maximum profit) of $200, while the maximum loss is $300 [$40 long call strike - $35 short call strike - $3.00 net credit].
The risk/reward ratio of the $40 long call isn’t much different than the $45 long call from above. However, the loss probability is almost double, making it a much tougher bet. I’d stick with the $40 call short.
Ratio Call Spread
The final strategy is the ratio call spread, which involves buying different quantities of call options at different strike prices. The strategy capitalizes on price movement while receiving a net credit. As with the two previous strategies, the expiration dates for all calls used in the ratio call spread must be the same.
So, like the two previous strategies, we’ll have to decouple the two unusually active call options to make this work. A common play involves buying one call and selling two calls with a higher strike price. It is a combination of a bull call spread and a naked call (you don’t own the stock).
For illustrative purposes, let’s assume that the $41.50 and $40 calls have the same Dec. 26 expiration date. As I write this on Thursday morning, I see that there is no $41.50 call strike available for the Dec. 26 expiration date, but there is a $41 strike and higher by $1 increments.
To be successful in this trade, you want the share price at expiry to be lower than the higher strike price.
So, first, the $40 call you’d buy has an ask price of $3.60, with volume of 34.
 Because you want to generate a net credit, you’ll need to sell two calls for bid prices of $1.65 or higher. That gives you two possibilities.
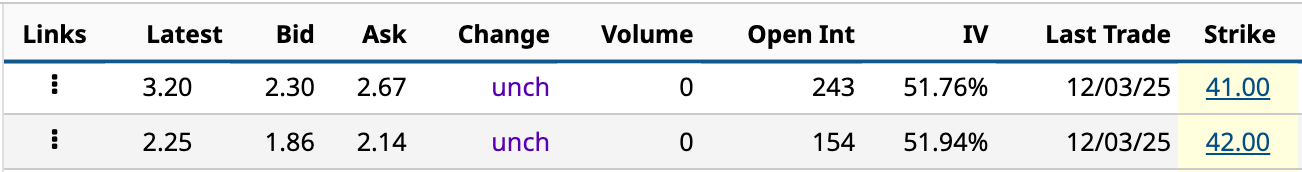
Unfortunately, there’s no volume, but let’s assume these bid prices are real. The $41 strike has a $135 net credit [$2.30 bid price * 2 - $3.25 ask price]. The $42 strike has a $47 net credit [$1.86 bid price * 2 - $3.25 ask price].
If the share price is $42 on Dec. 26, the two short calls expire worthless, while the long $40 call is $2 ITM (in the money). You achieve a maximum gain of $247 [$42 long call strike - $40 short call strike + $47 net credit].
However, if the share price at expiration is $44, for example, your gain is $47 [$44 share price - $40 strike price * 100 shares + $42 strike price - $44 share price * 200 shares + $47 net credit]. You break even if the share price is $44.47 at expiration [$44.47 share price - $40 strike price * 100 shares + $42 strike price - $44.47 share price * 200 shares + $47 net credit]. Above $44.47, you’re into unlimited losses.
Fun stuff.
On the date of publication, Will Ashworth did not have (either directly or indirectly) positions in any of the securities mentioned in this article. All information and data in this article is solely for informational purposes. For more information please view the Barchart Disclosure Policy here.
More news from Barchart
- 3 Ways to Play Celsius Holdings’ 2 Unusually Active Call Options
- Box Inc’s (BOX) Probability Density Just Shifted—Uncovering a 110% Structural Arbitrage Trade
- Options Action: Naked Put Trade Ideas for December 3rd
- Is the Wheel the Best Options Strategy for Income? Here’s How to Trade Options Like Warren Buffett