New York-based MSCI Inc. (MSCI) provides critical decision support tools and solutions for the investment community to manage investment processes worldwide. With a market cap of $41.1 billion, MSCI's offerings include portfolio construction and risk management products and services, ESG research and ratings, real estate research, and more.
Companies worth $10 billion or more are generally described as "large-cap stocks." MSCI fits right into that category, with its market cap exceeding this threshold, reflecting its substantial size, influence, and dominance in the finance sector.
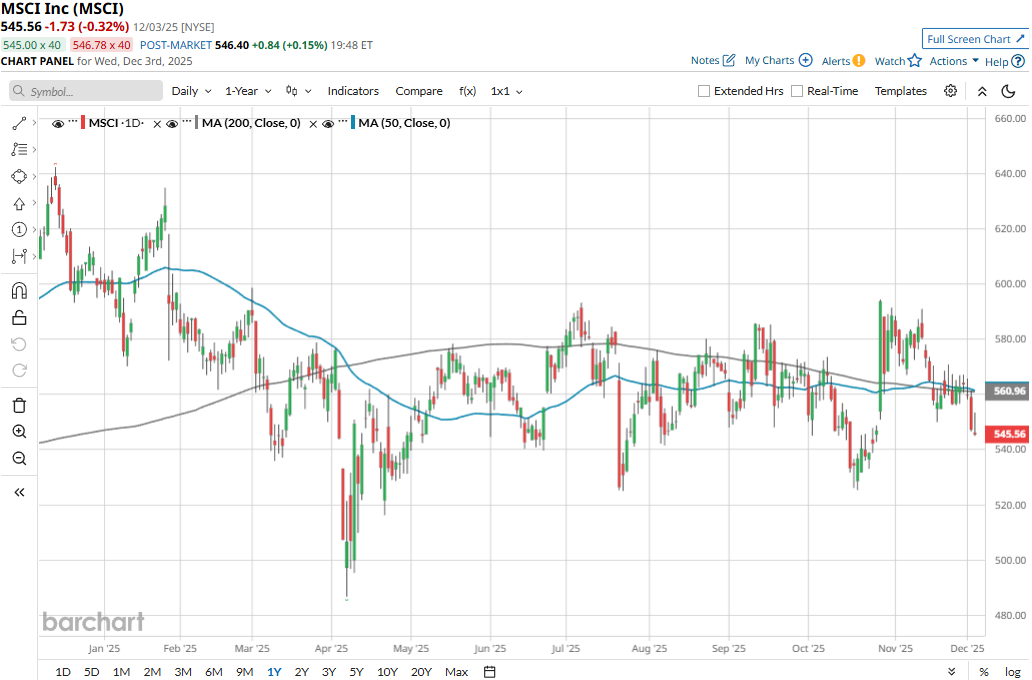
MSCI touched its three-year high of $642.45 on Dec. 12, 2024, and is currently trading 15.1% below that peak. Meanwhile, MSCI stock prices have dipped 1.1% over the past three months, compared to the Financial Select Sector SPDR Fund’s (XLF) 9 bps uptick during the same time frame.
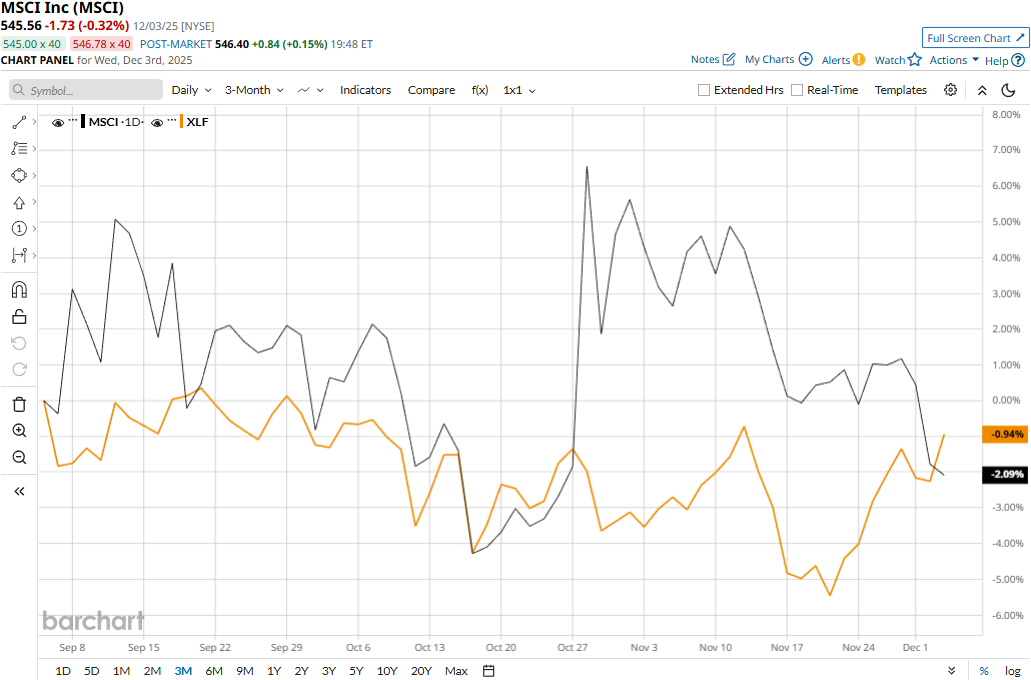
MSCI has notably underperformed over the longer term. MSCI stock prices have declined 9.1% on a YTD basis and 10.3% over the past 52 weeks, compared to XLF’s 10.8% surge in 2025 and 6.1% gains over the past year.
MSCI stock has traded mostly below its 200-day moving average since March, with some fluctuations, and along its downward-sloping 50-day moving average over the past year, underscoring its bearish movement.
MSCI’s stock prices have soared 8.6% in the trading session following the release of its Q3 results on Oct. 28. The company delivered strong financials and sales performance, including record Q3 recurring sales in two of its largest product lines. Overall, its operating revenues surged 9.5% year-over-year to $793.4 million, but missed the Street’s expectations by a thin margin. Nonetheless, its adjusted EPS increased by an impressive 15.8% year-over-year to $4.47, beating the consensus estimates by 2.3%.
However, MSCI has notably underperformed its peer, Cboe Global Markets, Inc.’s (CBOE) 29.9% surge on a YTD basis and 19.7% gains over the past year.
Among the 19 analysts covering the MSCI stock, the consensus rating is a “Moderate Buy.” Its mean price target of $653.41 suggests a 19.8% upside potential from current price levels.
On the date of publication, Aditya Sarawgi did not have (either directly or indirectly) positions in any of the securities mentioned in this article. All information and data in this article is solely for informational purposes. For more information please view the Barchart Disclosure Policy here.
More news from Barchart
- Grain Market Update: Where are Corn and Soybean Prices Headed?
- This High-Yield Utility Stock Is a Top AI Buy
- Is the Wheel the Best Options Strategy for Income? Here’s How to Trade Options Like Warren Buffett
- Ford Just Reported an Absolute Collapse in Its EV Sales. That Could Be a Key Warning for Tesla Stock.