Baker Hughes Company (BKR), with headquarters in Houston, Texas, is a leading energy technology provider worldwide. Operating in several countries, the company serves upstream, midstream, downstream, onshore, and offshore firms.
The firm runs via two central units: Oilfield Services and Equipment (OFSE) offers drilling, evaluation, completion, production, and subsea technologies for oil, gas, and geothermal operations; while Industrial & Energy Technology (IET) supplies gas systems, process tools, and emission controls for industrial and energy shift needs. The company has a market capitalization of $49.82 billion, which classifies it as a “large-cap” stock.
Baker Hughes’ shares reached a 52-week high of $51.12 on Dec. 4, and are down only 1% from that level. Based on strong quarterly results and sound analyst sentiments, the stock has gained 9.3% over the past three months. However, the stock underperformed its peers, as the SPDR S&P Oil & Gas Equipment & Services ETF (XES) is up by 23.3% over the same period.
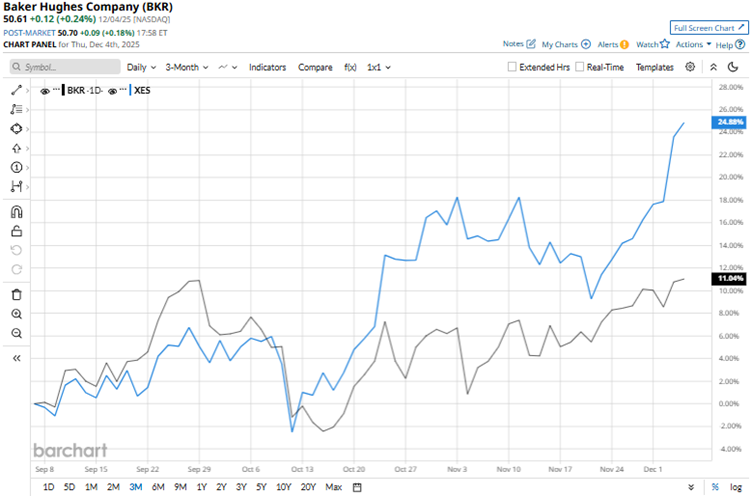
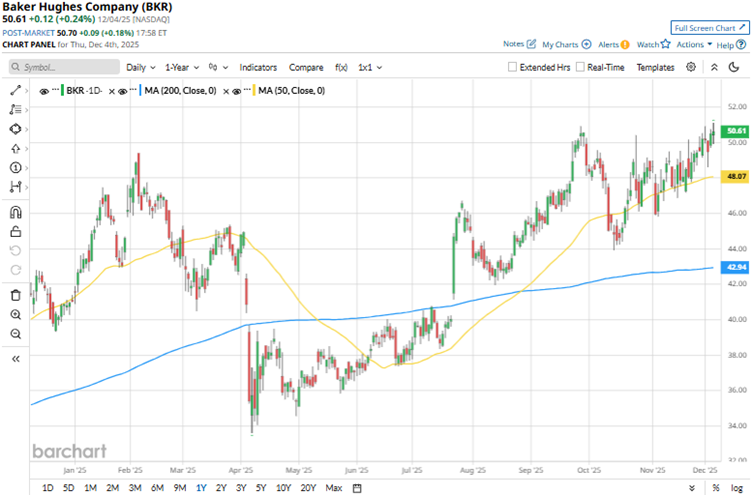
On the other hand, over the longer term, this substantial underperformance fades. Over the past six months, the stock has gained 35.7%, while the fund has gained 39.3%. Conversely, over the past 52 weeks, Baker Hughes’ shares have risen 18.9%, while the ETF has increased 3.5%. The stock has been trading above its 200-day moving average since late July and above its 50-day moving average since late November.
On Oct. 23, Baker Hughes reported its third-quarter results for 2025, which topped analyst estimates. However, the stock dropped 3.3% intraday on Oct. 24. The company’s revenues increased by a modest 1% year-over-year (YOY) to $7.01 billion, which was higher than the $6.83 billion that Wall Street analysts had expected. Its adjusted EPS increased 3% annually to $0.68, surpassing the $0.61 that analysts had expected.
The company’s order numbers are increasing rapidly. For Q3, Baker Hughes reported $8.21 billion in orders, up 23% YOY, based on rapid growth in its IET segment. One of the orders that Baker Hughes booked was an award from Aramco to expand its integrated underbalanced coiled tubing drilling (UBCTD) fleet from four to 10 units in Saudi Arabia’s natural gas fields.
Last month, Baker Hughes received an award from engineering company Bechtel Energy Inc. to supply primary liquefaction equipment for NextDecade’s Rio Grande LNG expansion. The company is also set to play a decisive role in the ambitious Alaska LNG project by providing power generation equipment and main refrigerant compressors. In this project, the company serves as both a tech provider and an investor.
We compare Baker Hughes’ performance with that of another oilfield services stock, Halliburton Company (HAL), which has declined 9.1% over the past 52 weeks but gained 39.1% over the past six months. Therefore, BKR has been the clear outperformer over the past 52 weeks.
Wall Street analysts are strongly bullish on Baker Hughes’ stock. The stock has a consensus rating of “Strong Buy” from the 19 analysts covering it. The mean price target of $54.33 indicates a 7.4% upside compared to current levels. The Street-high price target of $60 indicates an 18.6% upside.
On the date of publication, Anushka Dutta did not have (either directly or indirectly) positions in any of the securities mentioned in this article. All information and data in this article is solely for informational purposes. For more information please view the Barchart Disclosure Policy here.
More news from Barchart