Gartner, Inc. (IT), headquartered in Stamford, Connecticut, delivers research, data, and advisory support that guide leaders across industries. It operates through Research; Conferences; and Consulting segments, helping organizations make informed decisions and elevate performance with tightly integrated insights.
With a market cap hovering around $16.7 billion, Gartner commands a solid “large-cap” presence, providing organizations with proven support in cost efficiency, sourcing effectiveness, and leadership alignment.
Yet, the stock’s trajectory has been challenging. IT shares trade roughly 60.3% below the Feb high of $584.01, under notable market pressure. Over the past three months, the stock has slipped nearly 2%, while the Information Technology ETF Vanguard (VGT) advanced 9.6% during the same period, underscoring the performance gap.
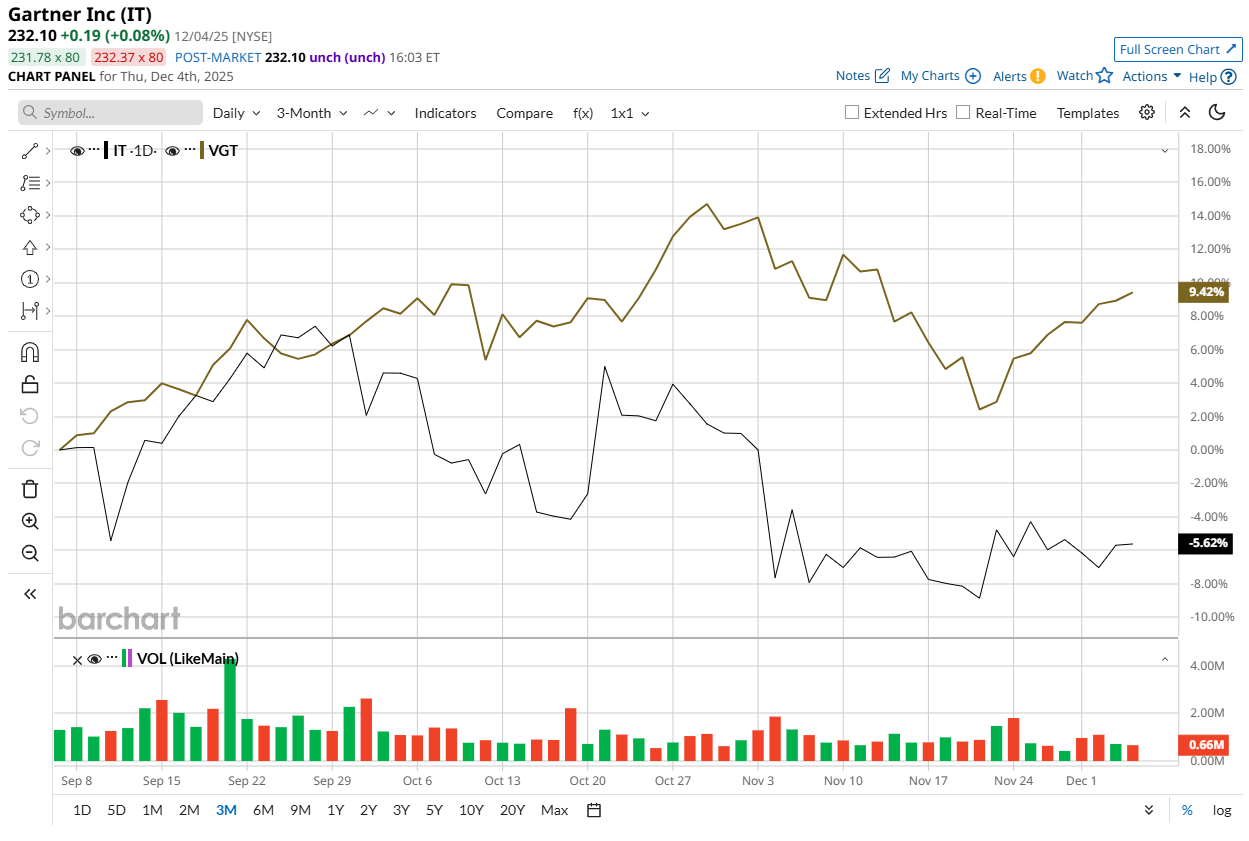
The longer view hardly brightens the picture. Over the past 52 weeks, IT has fallen 55.6%, with a year-to-date (YTD) drop of 52.1%. Meanwhile, VGT has gained 18.7% and 23% over the respective periods.
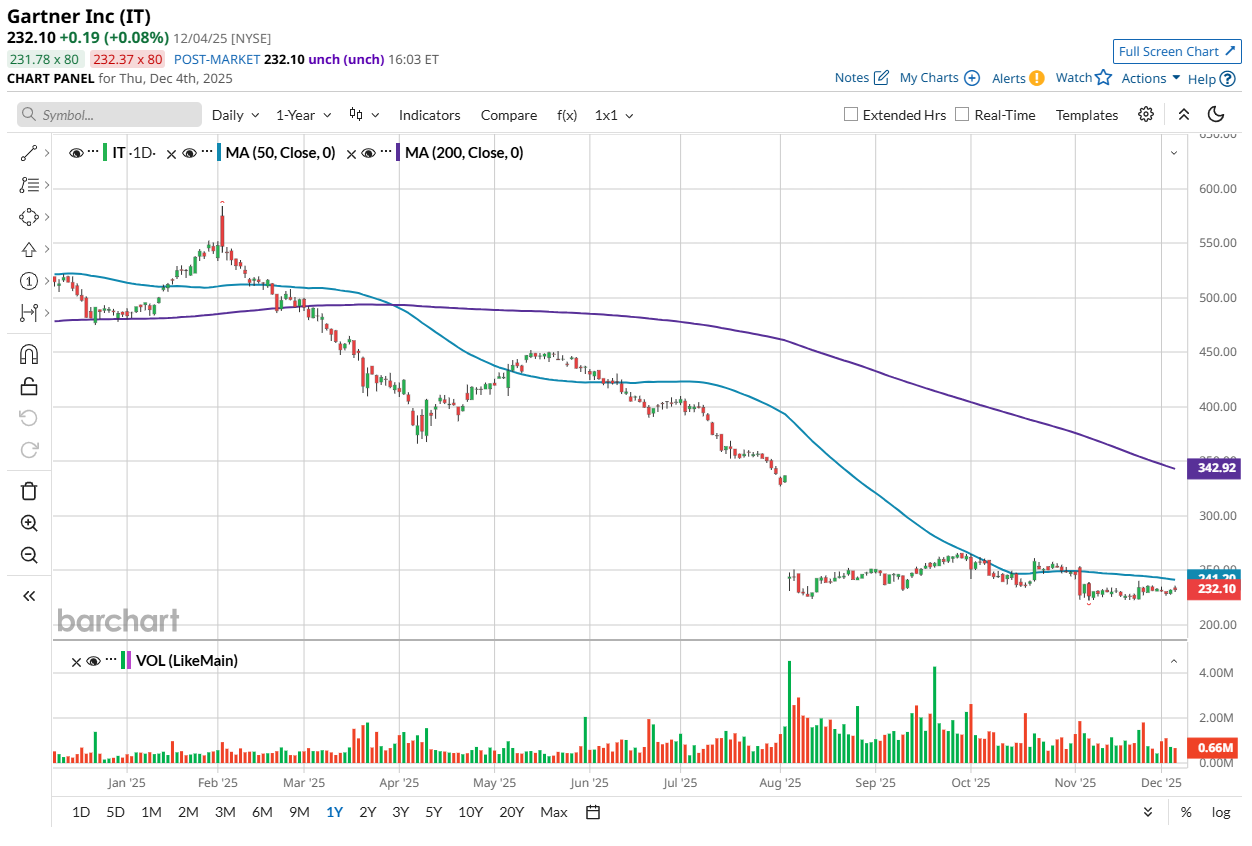
Technical indicators reinforce the bearish trend. IT has traded below its 50-day moving average of $241.20 and its 200-day moving average of $342.92 since March. Brief rebounds in May and then in the Sep–Oct period failed to clear these declining averages, creating a persistent overhead resistance.
Still, all is not gloom. Gartner’s stock climbed nearly 4.4% on Nov 5, a day after the company reported Q3 fiscal 2025 earnings that met Wall Street expectations. Revenue rose 2.7% year-over-year to $1.52 billion, coming in line with analyst estimates. Adjusted EPS jumped 10.4% to $2.76, beating forecasts of $2.43.
The company also reinforced shareholder value through a $1 billion stock repurchase, trimming the share count by 6% year-over-year and strengthening long-term returns. Building on this momentum, management raised full-year guidance, projecting Insights revenue of at least $5.06 billion, Conferences $630 million, and Consulting $575 million.
Additionally, full-year EBITDA now stands at a minimum of $1.575 billion, up $60 million from prior guidance, and lifting margins to 24.3%. Adjusted EPS for 2025 is expected to reach $12.65, underscoring confidence in sustainable growth and profitability.
For perspective, Gartner's rival, Accenture plc (ACN), has tumbled 25.2% over the last 52 weeks and 23.4% YTD, signaling persistent pressure across the sector.
Despite near-term pressure on the stock, optimism around future growth is keeping analysts upbeat. Wall Street maintains a “Moderate Buy” consensus rating from 14 analysts, with a mean price target of $278.18, representing 19.9% potential upside from current trading levels.
On the date of publication, Aanchal Sugandh did not have (either directly or indirectly) positions in any of the securities mentioned in this article. All information and data in this article is solely for informational purposes. For more information please view the Barchart Disclosure Policy here.
More news from Barchart
- Is This Dividend Stock a Buy for 2026 After Rising 265% in 2025?
- Archer Aviation Just Signed on a New Aerospace Partner. Should You Buy ACHR Stock Here?
- Stifel Says This 1 ‘Picks and Shovels’ AI Stock Is a Buy for Massive Growth in 2026
- As Trump Looks to Boost Robotics, This 1 Lesser-Known Stock Is a Strong Buy