Jersey City, New Jersey-based Verisk Analytics, Inc. (VRSK) provides data analytics and technology solutions to the insurance markets. With a market cap of $31.3 billion, the company offers data, statistical, and actuarial services, as well as standardized insurance policy programs, underwriting information, and rating-integrity tools. VRSK provides data and software information services to the property, casualty, and mortgage fields.
Companies worth $10 billion or more are generally described as “large-cap stocks,” and VRSK perfectly fits that description, with its market cap exceeding this mark, underscoring its size, influence, and dominance within the consulting services industry. VRSK solidifies its market leadership in insurance data analytics, driven by its strong brand and innovative solutions. As an industry standard, Verisk's proprietary databases and analytical tools are widely adopted for key applications, including underwriting, claims, and fraud detection. The company's ongoing investment in enhancing its models and content has yielded increased sales to both new and existing customers, further entrenching its dominant market position.
Despite its notable strength, VRSK slipped 31.2% from its 52-week high of $322.92, achieved on Jun. 5. Over the past three months, VRSK stock has declined 17.8%, underperforming the S&P 500 Index’s ($SPX) 5.5% gains during the same time frame.
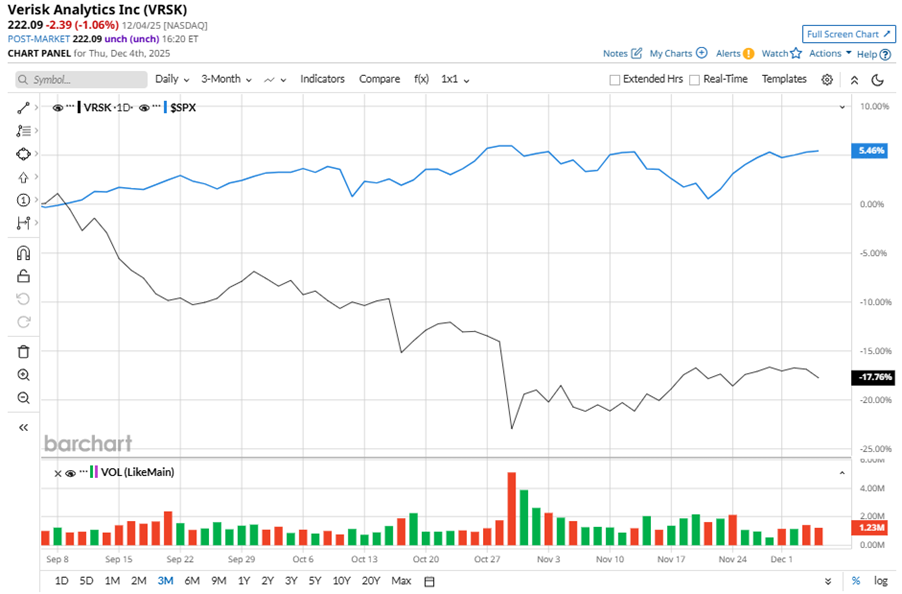
In the longer term, shares of VRSK fell 30.9% on a six-month basis and dipped 23.9% over the past 52 weeks, considerably underperforming SPX’s six-month gains of 14.8% and 12.7% returns over the last year.
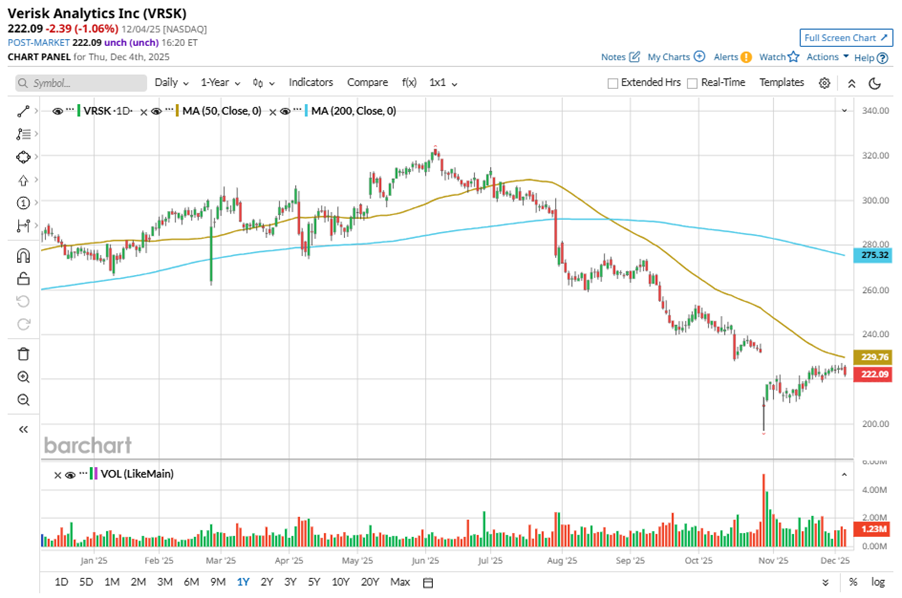
To confirm the bearish trend, VRSK has been trading below its 50-day moving average since early July. The stock has been trading below its 200-day moving average since late July.
VRSK's underperformance is due to low severe weather and no U.S. landfalling hurricanes, which have reduced claims activity and demand for property claims estimating tools. The company lowered its 2025 revenue guidance due to mild weather and a reduced government contract. Its pending issues include the AccuLynx deal under FTC review and softness in the Personal Lines Auto segment due to competition.
On Oct. 29, VRSK shares closed down more than 10% after reporting its Q3 results. Its adjusted EPS of $1.72 surpassed Wall Street expectations of $1.69. The company’s revenue was $768.3 million, falling short of Wall Street's $774.7 million forecast. VRSK expects full-year revenue in the range of $3.05 billion to $3.08 billion.
In the competitive arena of consulting services, Equifax Inc. (EFX) has taken the lead over VRSK, with a 20.9% downtick on a six-month basis and 19.8% losses over the past 52 weeks.
Wall Street analysts are reasonably bullish on VRSK’s prospects. The stock has a consensus “Moderate Buy” rating from the 20 analysts covering it, and the mean price target of $262.94 suggests a potential upside of 18.4% from current price levels.
On the date of publication, Neha Panjwani did not have (either directly or indirectly) positions in any of the securities mentioned in this article. All information and data in this article is solely for informational purposes. For more information please view the Barchart Disclosure Policy here.
More news from Barchart
- Apple Made a Comeback with the iPhone 17, But Will Executive Exits Pull Down AAPL Stock?
- This Former Penny Stock Just Doubled for the Second Time This Week. Should You Chase the Rally Here?
- 3 High-Yield Stocks to Invest in Oracle’s AI Growth with Less Volatility
- iPhone Revenue Just Jumped 40%. Should You Buy AAPL Stock Here?