- Smart Sand (SND) is a leading producer of northern white fracking sand, benefiting from strong demand in the oil and gas sector.
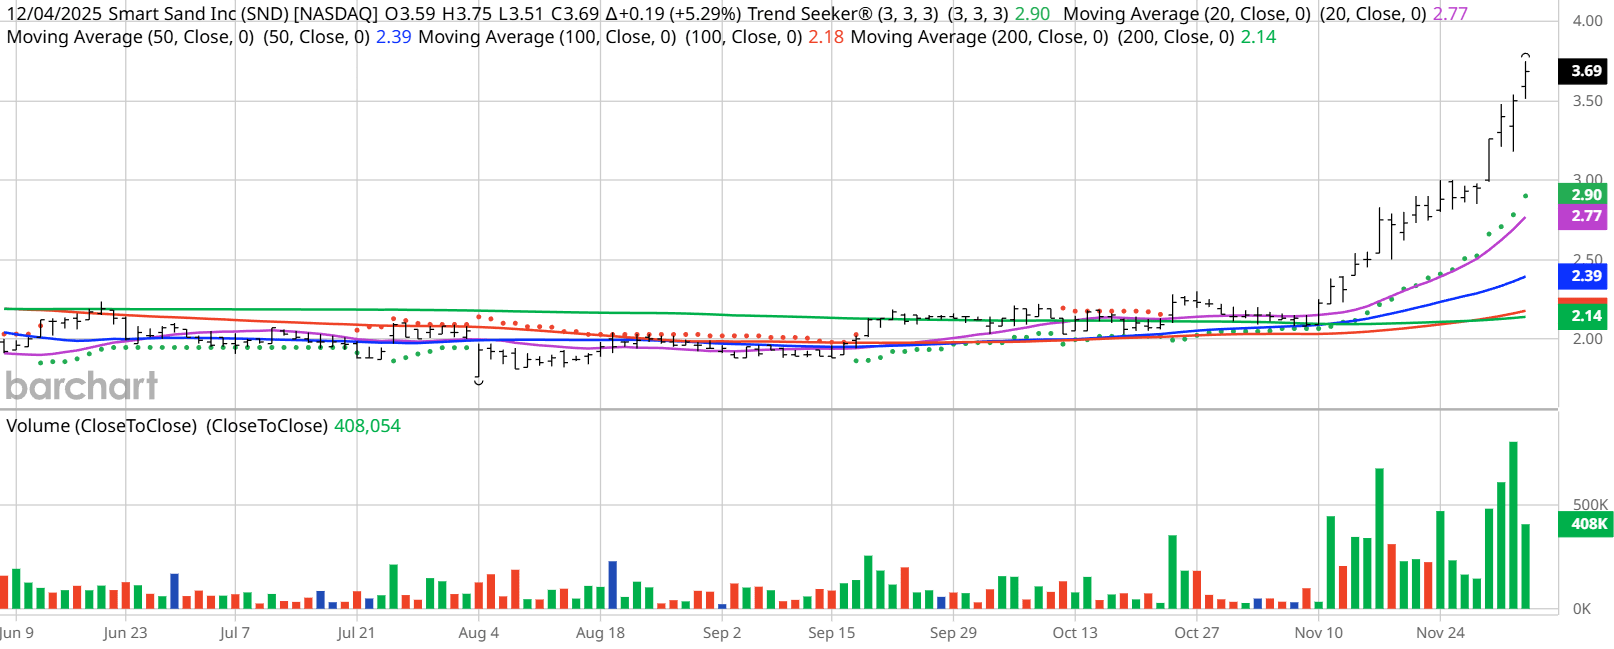
- SND has demonstrated exceptional technical momentum and is up 65% over the past year.
- The stock has a 100% “Buy” technical opinion from Barchart.
- Shares are trading at new 3-year highs as of Friday.
Today’s Featured Stock
Valued at $168.5 million, Smart Sand (SND) is a producer of northern white raw fracking sand for the oil and gas industry. It offers proppant and related logistics services for oil and gas recovery from unconventional wells.
What I’m Watching
I found today’s Chart of the Day by using Barchart’s powerful screening functions to sort for stocks with the highest technical buy signals; superior current momentum in both strength and direction; and a Trend Seeker “buy” signal. I then used Barchart’s Flipcharts feature to review the charts for consistent price appreciation. SND checks those boxes. Since the Trend Seeker signaled a new “Buy” on Sept. 18, the stock has gained 83.96%.
Barchart Technical Indicators for Smart Sand
Editor’s Note: The technical indicators below are updated live during the session every 20 minutes and can therefore change each day as the market fluctuates. The indicator numbers shown below therefore may not match what you see live on the Barchart.com website when you read this report. These technical indicators form the Barchart Opinion on a particular stock.
Smart Sand hit a 3-year high of $3.94 on Dec. 5.
- SND has a Weighted Alpha of +87.87.
- Smart Sand has a 100% “Buy” opinion from Barchart.
- The stock gained 65.82% over the past year.
- SND has its Trend Seeker “Buy” signal intact.
- The stock recently traded at $3.72 with a 50-day moving average of $2.48.
- Smart Sand made 17 new highs and gained 84.51% in the last month.
- Relative Strength Index (RSI) is at 85.71.
- There’s a technical support level around $3.62.
Don’t Forget the Fundamentals
- $168.5 million market capitalization.
- Wall Street does not follow this stock, so there aren’t any revenue and earnings projections.
Analyst and Investor Sentiment on Smart Sand
It looks like Wall Street hasn't discovered this stock yet, but individual investors have.
- The Wall Street analysts tracked by Barchart are not following this stock yet.
- Value Line rates it “Below Average.”
- CFRA’s MarketScope Advisor rates it a “Buy.”
- Morningstar thinks even with the stock’s recent runup, it’s fairly valued.
- 70 investors following the stock on Motley Fool think the stock will beat the market while 25 think it won't.
- 4,380 investors are monitoring the stock on Seeking Alpha.
- Short interest is small at 0.27% of the float.
The Bottom Line on Smart Sand
As long as the oil industry continues to frack, they will need fracking sand, and Smart Sand mines some of the best northern white sand available.
Today’s Chart of the Day was written by Jim Van Meerten. Read previous editions of the daily newsletter here.
Additional disclosure: The Barchart of the Day highlights stocks that are experiencing exceptional current price appreciation. They are not intended to be buy recommendations as these stocks are extremely volatile and speculative. Should you decide to add one of these stocks to your investment portfolio it is highly suggested you follow a predetermined diversification and moving stop loss discipline that is consistent with your personal investment risk tolerance.
On the date of publication, Jim Van Meerten did not have (either directly or indirectly) positions in any of the securities mentioned in this article. All information and data in this article is solely for informational purposes. For more information please view the Barchart Disclosure Policy here.
More news from Barchart