Chicago, Illinois-based Archer-Daniels-Midland Company (ADM) procures, transports, stores, processes, and merchandises agricultural commodities, ingredients, flavors, and solutions. With a market cap of $28.4 billion, the company processes oilseeds, corn, milo, oats, barley, peanuts, and wheat, as well as produce products which have primarily two end uses, including food or feed ingredients.
Companies worth $10 billion or more are generally described as “large-cap stocks,” and ADM perfectly fits that description, with its market cap exceeding this mark, underscoring its size, influence, and dominance within the farm products industry. ADM leverages a competitive edge through its extensive network of processing facilities and logistics assets, enabling efficient management of diverse agricultural commodities and solidifying its role as a critical player in the global food supply chain. Strategic acquisitions and a strong commitment to innovation enhance its capabilities, expand its reach, and position the company for future growth in sustainable nutrition.
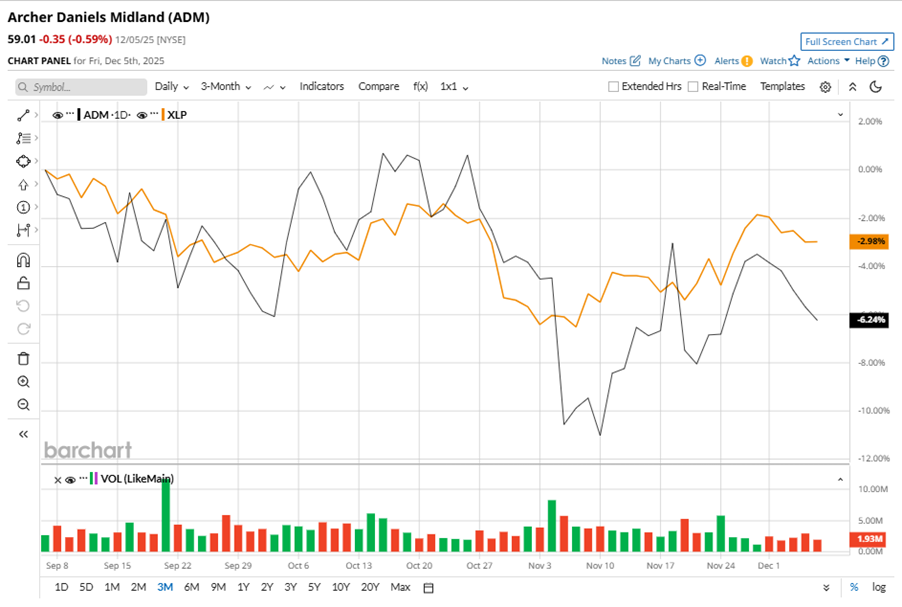
Despite its notable strength, ADM slipped 9.2% from its 52-week high of $65, achieved on Oct. 27. Over the past three months, ADM stock declined 6.2%, underperforming the Consumer Staples Select Sector SPDR Fund’s (XLP) 3% drop during the same time frame.
In the longer term, shares of ADM rose 25.6% on a six-month basis and climbed 12.9% over the past 52 weeks, outperforming XLP’s six-month 3.7% losses and 5.2% dip over the last year.
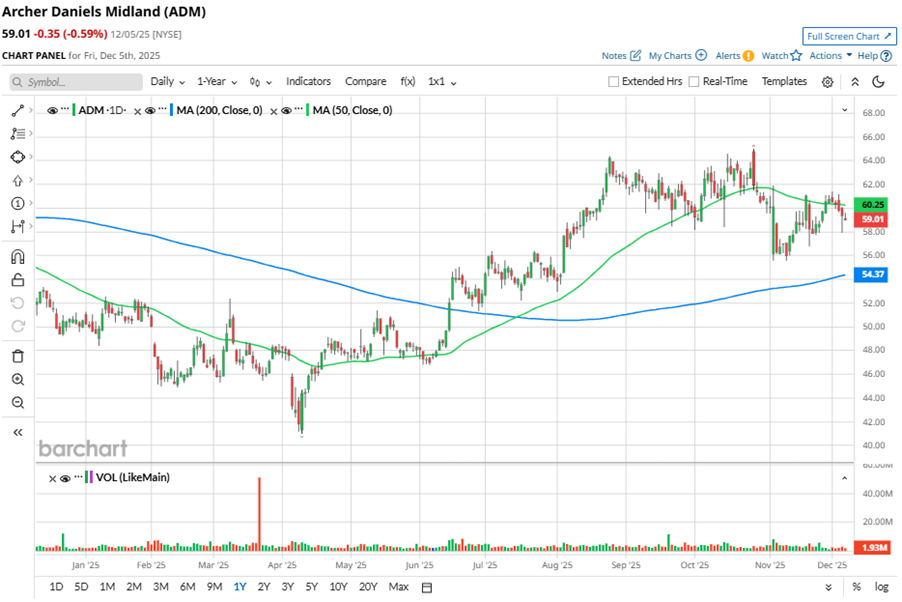
To confirm the bullish trend, ADM has been trading above its 200-day moving average since mid-June. However, the stock has been trading below its 50-day moving average since late October, with minor fluctuations.
On Nov. 4, ADM reported its Q3 results, and its shares closed down more than 6% in the following trading session. Its adjusted EPS of $0.92 beat Wall Street expectations of $0.89. The company’s revenue stood at $20.4 billion, up 2.2% year over year. ADM expects full-year adjusted EPS in the range of $3.25 to $3.50.
In the competitive arena of farm products, Bunge Global SA (BG) has taken the lead over ADM, showing resilience with a 26.8% uptick on a six-month basis, but lagged behind the stock with solid 8.6% gains over the past 52 weeks.
Wall Street analysts are cautious on ADM’s prospects. The stock has a consensus “Hold” rating from the 11 analysts covering it. While ADM currently trades above its mean price target of $56.89, the Street-high price target of $70 suggests an 18.6% upside potential.
On the date of publication, Neha Panjwani did not have (either directly or indirectly) positions in any of the securities mentioned in this article. All information and data in this article is solely for informational purposes. For more information please view the Barchart Disclosure Policy here.
More news from Barchart