ETFOptimize | High-performance ETF-based Investment Strategies

Quantitative strategies, Wall Street-caliber research, and insightful market analysis since 1998.


ETFOptimize | HOME
Close Window

How Is The Hartford's Stock Performance Compared to Other Property & Casualty Insurance Stocks?

With a market cap of $36.1 billion, The Hartford Insurance Group, Inc. (HIG) is a long-established provider of insurance and financial services operating across the United States, the U.K., and internationally. The company serves both individuals and businesses through segments that include Business Insurance, Personal Insurance, Employee Benefits, Property & Casualty Other Operations, and Hartford Funds. 

Companies worth more than $10 billion are generally labeled as “large-cap” stocks and Hartford fits this criterion perfectly. Its offerings range from property, casualty, and employee benefits coverage to investment management and mutual fund products.


The Hartford, Connecticut-based company's stock has dipped 6.6% from its 52-week high of $138.64. Shares of Hartford Insurance have fallen 1.7% over the past three months, lagging behind the Invesco KBW Property & Casualty Insurance ETF’s (KBWP) marginal drop over the same time frame.

www.barchart.com

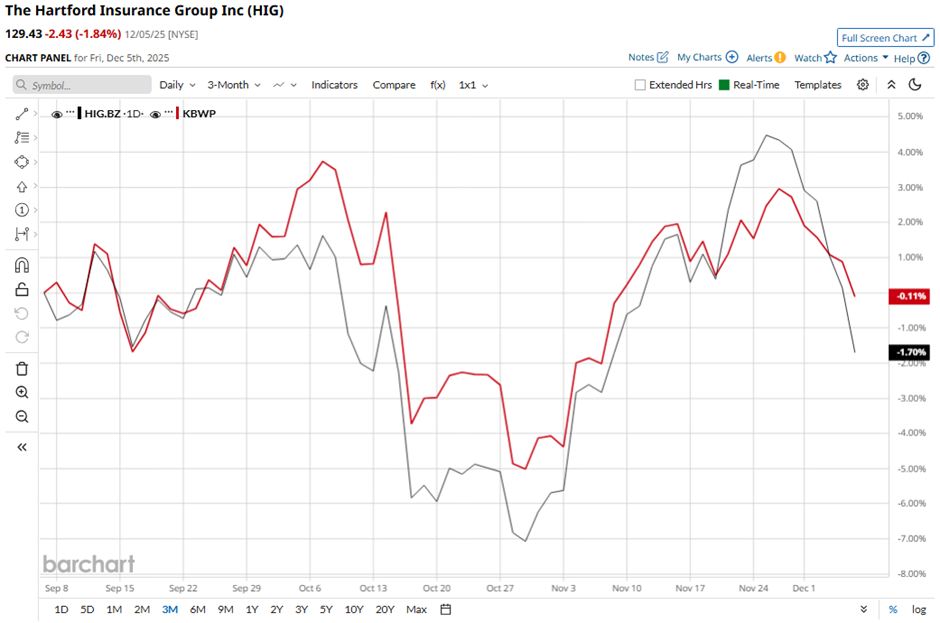
In the longer term, HIG stock is up 18.3% on a YTD basis, outperforming KBWP’s 4.4% gain. Moreover, shares of the property and casualty insurance firm have increased 6.8% over the past 52 weeks, compared to KBWP’s 2.9% decrease over the same time frame.

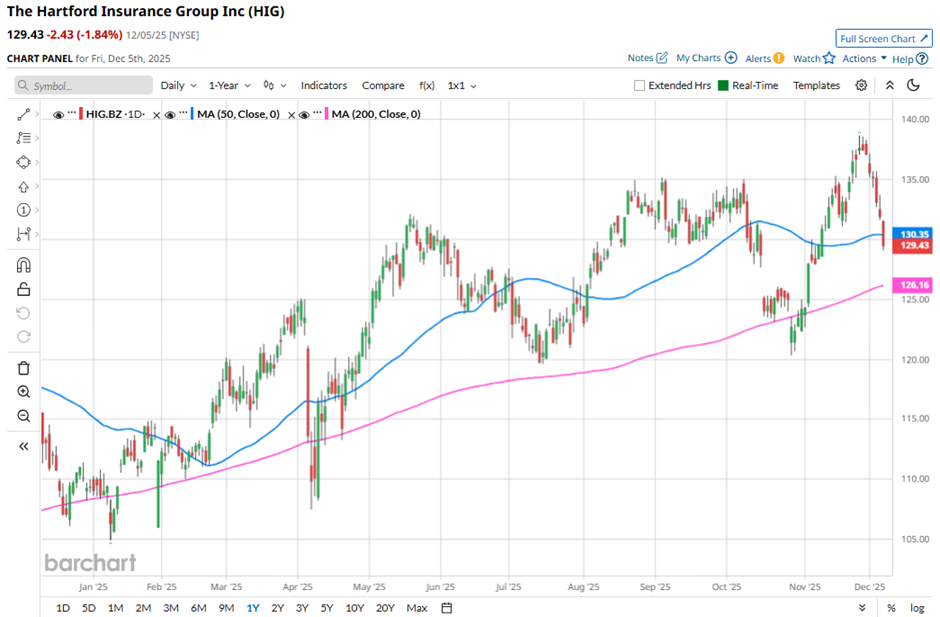
HIG stock has been trading above its 200-day moving average since last year. In addition, it has moved above its 50-day moving average since mid-February.

www.barchart.com

The Hartford reported a 41% jump in Q3 2025 profit on Oct. 27, with net income climbing to $1.07 billion ($3.77 per share) from $761 million ($2.56 per share) a year earlier. Investors also reacted positively to strong underwriting results, including a combined ratio of 88.8% in the business insurance segment, an improvement from 92.2% last year. Additionally, property and casualty written premiums grew 7%, driven by a 9% surge to $3.57 billion in business insurance premiums, aided by a quiet catastrophe season. However, the stock fell 1.8% the next day.

In comparison, rival The Allstate Corporation (ALL) has lagged behind HIG stock. Shares of Allstate have gained 4.9% on a YTD basis and declined marginally over the past 52 weeks. 

While HIG stock has outperformed over the past year, analysts remain cautiously optimistic about its prospects. The stock has a consensus rating of “Moderate Buy” from 25 analysts' coverage, and the mean price target of $143.14 is a premium of 10.6% to current levels.


On the date of publication, Sohini Mondal did not have (either directly or indirectly) positions in any of the securities mentioned in this article. All information and data in this article is solely for informational purposes. For more information please view the Barchart Disclosure Policy here.


More news from Barchart

Recent Quotes

View More
Symbol Price Change (%)
AMZN  226.76
+0.00 (0.00%)
AAPL  272.19
+0.00 (0.00%)
AMD  201.06
+0.00 (0.00%)
BAC  54.26
+0.00 (0.00%)
GOOG  303.75
+0.00 (0.00%)
META  664.45
+0.00 (0.00%)
MSFT  483.98
+0.00 (0.00%)
NVDA  174.14
+0.00 (0.00%)
ORCL  180.03
+0.00 (0.00%)
TSLA  483.37
+0.00 (0.00%)
Stock Quote API & Stock News API supplied by www.cloudquote.io
Quotes delayed at least 20 minutes.
By accessing this page, you agree to the Privacy Policy and Terms Of Service.


IntelligentValue Home
Close Window

DISCLAIMER

All content herein is issued solely for informational purposes and is not to be construed as an offer to sell or the solicitation of an offer to buy, nor should it be interpreted as a recommendation to buy, hold or sell (short or otherwise) any security.  All opinions, analyses, and information included herein are based on sources believed to be reliable, but no representation or warranty of any kind, expressed or implied, is made including but not limited to any representation or warranty concerning accuracy, completeness, correctness, timeliness or appropriateness. We undertake no obligation to update such opinions, analysis or information. You should independently verify all information contained on this website. Some information is based on analysis of past performance or hypothetical performance results, which have inherent limitations. We make no representation that any particular equity or strategy will or is likely to achieve profits or losses similar to those shown. Shareholders, employees, writers, contractors, and affiliates associated with ETFOptimize.com may have ownership positions in the securities that are mentioned. If you are not sure if ETFs, algorithmic investing, or a particular investment is right for you, you are urged to consult with a Registered Investment Advisor (RIA). Neither this website nor anyone associated with producing its content are Registered Investment Advisors, and no attempt is made herein to substitute for personalized, professional investment advice. Neither ETFOptimize.com, Global Alpha Investments, Inc., nor its employees, service providers, associates, or affiliates are responsible for any investment losses you may incur as a result of using the information provided herein. Remember that past investment returns may not be indicative of future returns.

Copyright © 1998-2017 ETFOptimize.com, a publication of Optimized Investments, Inc. All rights reserved.