Most investors don’t watch Japanese government bond yields, but they should.
In a new segment from Market on Close, Senior Market Strategist John Rowland, CMT, breaks down why a potential Bank of Japan (BOJ) rate hike could be the most important macro event for global markets — especially for tech stocks like Nvidia (NVDA), Meta Platforms (META), Microsoft (MSFT), and the entire Invesco QQQ Trust (QQQ).
Right now, markets are focused on the Federal Reserve cutting rates. But in the background, Japan — the world’s third-largest holder of U.S. Treasurys — is moving very differently:
➡️ Markets are pricing in an 80% chance of a rate hike this month
➡️ Japanese bond yields are surging in response
➡️ The yen is also rising
This combination could unwind one of the most important, yet least understood, forces behind the stock market rally of the past decade: the yen carry trade. And if it unwinds too fast, it could spark what John calls a “giant global margin call.”
Let’s break this down in a way traders and investors can actually use.
The Yen Carry Trade, Explained
For nearly a decade, Japan kept interest rates near zero while the U.S. raised rates sharply.
Hedge funds and institutions took advantage by:
- Borrowing in yen for cheap
- Converting that yen into dollars
- Buying higher-yielding assets, like: U.S. Treasurys (TLT, GOVT); tech stocks (NVDA, META, MSFT); and commodities (gold, oil stocks)
- Later selling those assets
- Buying back yen
- Pocketing the difference
The trade works flawlessly… as long as the yen stays weak.
Why BOJ Rate Hikes Are a Problem
If the BOJ raises rates even modestly, the entire equation changes:
- Borrowing yen becomes more expensive
- The yen strengthens
- Traders start to unwind yen carry positions
- That triggers selling in U.S. tech stocks, Treasurys, and commodities
Even small moves in the yen can trigger massive leverage unwinds, and we’ve already seen a preview. Long-term U.S. yields have started rising again, with the 10-year (TNX) bouncing back toward 4.10%–4.20%.
If yields push back above 4.5%, John says that could be the catalyst for a larger-scale unwinding.
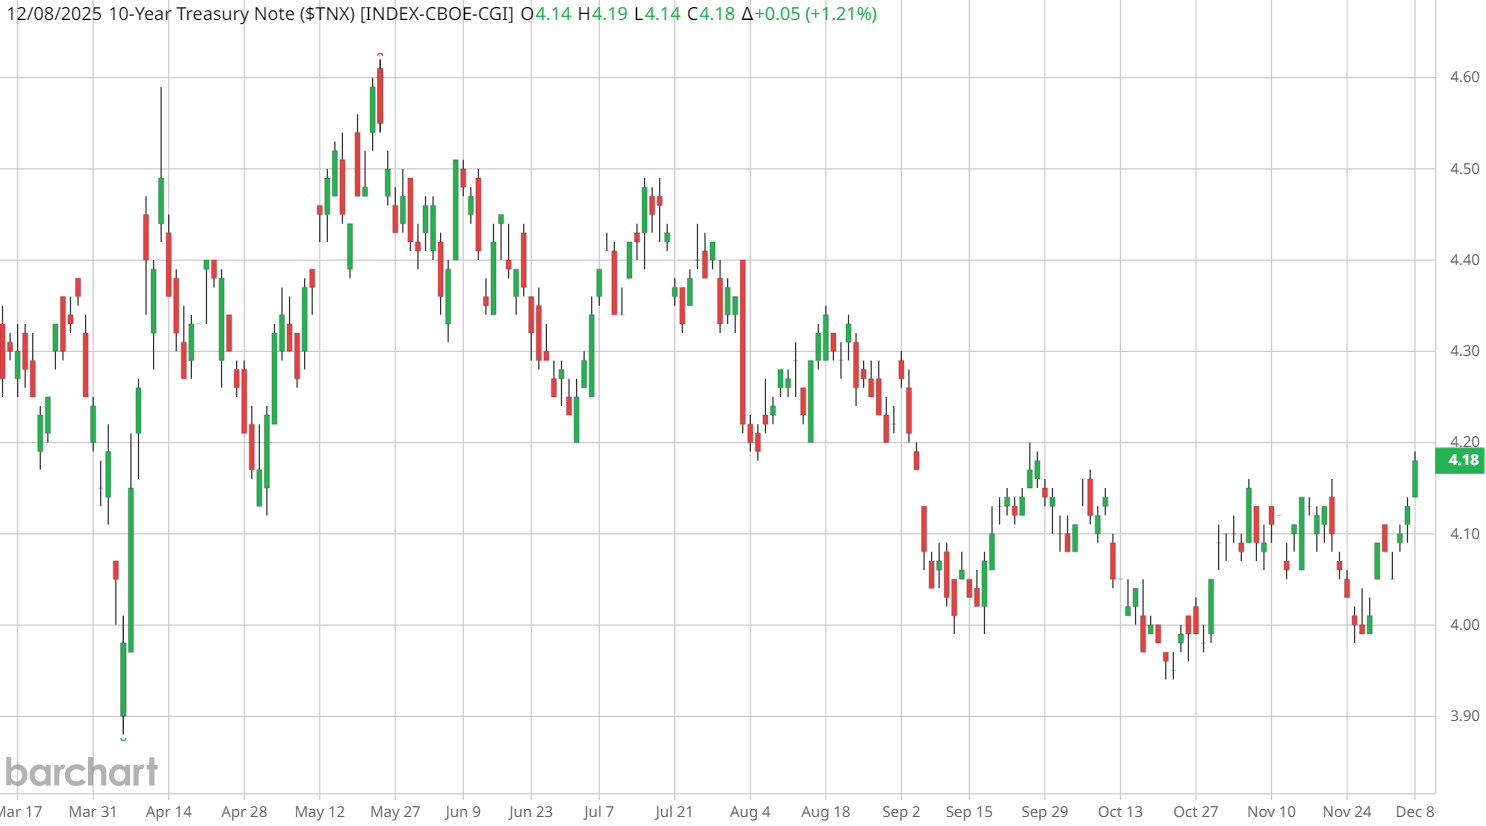
Higher yields = lower bond prices = pressure on tech valuations.
What Traders Should Watch Right Now
John highlights two key indicators:
1. USD/JPY (FXY)
- If the yen strengthens, unwind pressure builds.
- If USD/JPY falls sharply, expect volatility across equities.
2. U.S. 10-Year Yield (TNX)
If yields rise above 4.5%, John says it could spark:
- A rush out of high-valuation tech
- Selling in mega-cap growth
- Broad pressure on SPY and QQQ
- A potential spike in volatility
- A tightening of global liquidity
Why the Carry Trade Matters
Japan’s interest rate decision can move markets 6,000 miles away. This is one of the most important macro stories of the year. Make sure you’re positioned before the market reacts.
Want to see John detail the carry trade risk to markets this month — with charts, signals, and key levels?
➡️ Stream the full Market on Close episode
➡️ Use Barchart tools to track Treasury yields and global risk signals
On the date of publication, Barchart Insights did not have (either directly or indirectly) positions in any of the securities mentioned in this article. All information and data in this article is solely for informational purposes. For more information please view the Barchart Disclosure Policy here.
More news from Barchart
- DeepSeek Just Launched a New Challenger to Gemini 3. Will It Hurt the Bull Case for GOOGL Stock?
- A Major Shift in Adobe’s (ADBE) Risk Geometry Points to Fresh Upside
- Snowflake Stock is Down But Its FCF Margin Guidance Could Lead to a 22% Higher Price Target
- Is a Short Squeeze Brewing in iRobot Stock?