ETFOptimize | High-performance ETF-based Investment Strategies

Quantitative strategies, Wall Street-caliber research, and insightful market analysis since 1998.


ETFOptimize | HOME
Close Window

Is Biogen Stock Outperforming the Dow?

Cambridge, Massachusetts-based Biogen Inc. (BIIB) operates as a leading biotech firm, pioneering innovative science to deliver new medicines to transform patients’ lives and to create value for shareholders and communities. Valued at $26.6 billion by market cap, it has a deep understanding of human biology and leverages different modalities to advance first-in-class treatments or therapies that deliver superior outcomes.

Companies worth $10 billion or more are generally described as "large-cap stocks." Biogen fits right into that category, with its market cap exceeding this threshold, reflecting its substantial size, influence, and dominance in the biotech industry.


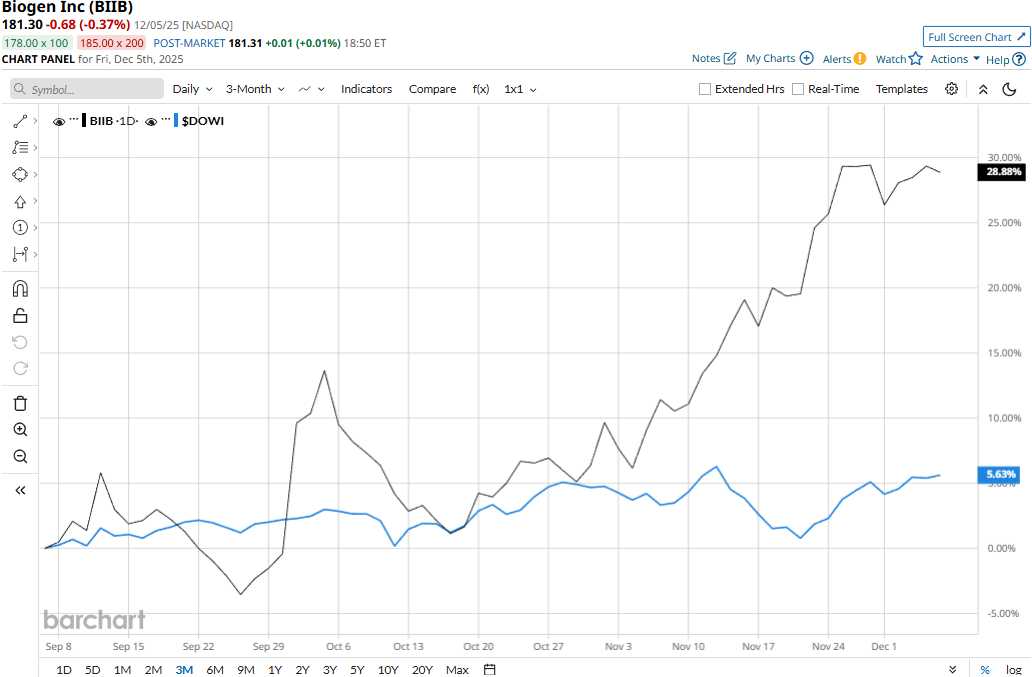
BIIB stock touched its 52-week high of $185.17 on Nov. 24 and is currently trading 2.1% below that peak. Meanwhile, the stock has soared 28.9% over the past three months, significantly outperforming the Dow Jones Industrial Average’s ($DOWI5.6% uptick during the same time frame.

www.barchart.com

Biogen has outperformed over the longer term as well. BIIB stock has gained 18.6% on a YTD basis and 13.8% over the past 52 weeks, compared to the Dow’s 12.7% gains in 2025 and 7.1% returns over the past year.

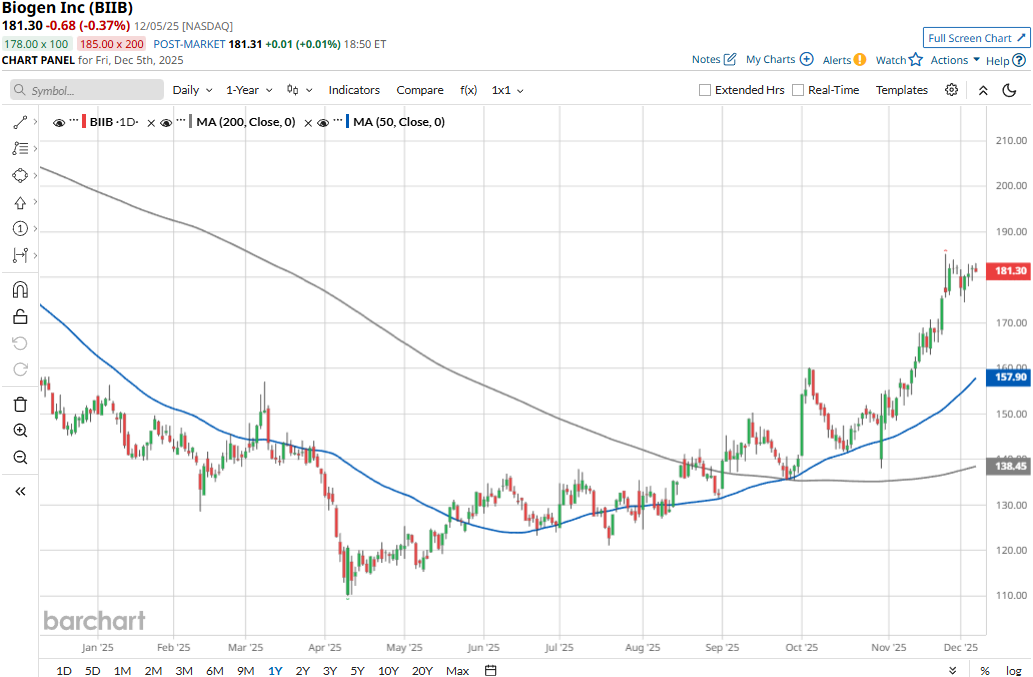
BIIB stock has traded mostly above its 50-day moving average since May and consistently above its 200-day moving average since early September, underscoring its bullish trend.

www.barchart.com

Biogen’s stock prices gained 1.2% in the trading session following the release of its better-than-expected Q3 results on Oct. 30. The company observed a solid 67% growth across its products launched for Alzheimer's disease, rare disease, and postpartum depression. Overall, its topline grew 2.8% year-over-year to $2.5 billion, beating the Street’s expectations by a notable 8.3%. Meanwhile, its adjusted EPS soared 17.9% year-over-year to $4.81, surpassing the consensus estimates by 23.7%.

Further, Biogen has notably outperformed its peer, Sarepta Therapeutics, Inc.’s (SRPT81.7% plunge in 2025 and an 82.4% decline over the past 52 weeks.

Among the 33 analysts covering the BIIB stock, the consensus rating is a “Moderate Buy.” As of writing, BIIB is trading slightly above its mean price target of $178.26.


On the date of publication, Aditya Sarawgi did not have (either directly or indirectly) positions in any of the securities mentioned in this article. All information and data in this article is solely for informational purposes. For more information please view the Barchart Disclosure Policy here.


More news from Barchart

Recent Quotes

View More
Symbol Price Change (%)
AMZN  223.81
+1.25 (0.56%)
AAPL  273.22
-1.39 (-0.51%)
AMD  200.50
-8.67 (-4.14%)
BAC  54.98
+0.17 (0.31%)
GOOG  299.66
-8.07 (-2.62%)
META  657.62
+0.47 (0.07%)
MSFT  476.80
+0.41 (0.09%)
NVDA  171.15
-6.57 (-3.70%)
ORCL  179.05
-9.60 (-5.09%)
TSLA  476.05
-13.83 (-2.82%)
Stock Quote API & Stock News API supplied by www.cloudquote.io
Quotes delayed at least 20 minutes.
By accessing this page, you agree to the Privacy Policy and Terms Of Service.


IntelligentValue Home
Close Window

DISCLAIMER

All content herein is issued solely for informational purposes and is not to be construed as an offer to sell or the solicitation of an offer to buy, nor should it be interpreted as a recommendation to buy, hold or sell (short or otherwise) any security.  All opinions, analyses, and information included herein are based on sources believed to be reliable, but no representation or warranty of any kind, expressed or implied, is made including but not limited to any representation or warranty concerning accuracy, completeness, correctness, timeliness or appropriateness. We undertake no obligation to update such opinions, analysis or information. You should independently verify all information contained on this website. Some information is based on analysis of past performance or hypothetical performance results, which have inherent limitations. We make no representation that any particular equity or strategy will or is likely to achieve profits or losses similar to those shown. Shareholders, employees, writers, contractors, and affiliates associated with ETFOptimize.com may have ownership positions in the securities that are mentioned. If you are not sure if ETFs, algorithmic investing, or a particular investment is right for you, you are urged to consult with a Registered Investment Advisor (RIA). Neither this website nor anyone associated with producing its content are Registered Investment Advisors, and no attempt is made herein to substitute for personalized, professional investment advice. Neither ETFOptimize.com, Global Alpha Investments, Inc., nor its employees, service providers, associates, or affiliates are responsible for any investment losses you may incur as a result of using the information provided herein. Remember that past investment returns may not be indicative of future returns.

Copyright © 1998-2017 ETFOptimize.com, a publication of Optimized Investments, Inc. All rights reserved.