ETFOptimize | High-performance ETF-based Investment Strategies

Quantitative strategies, Wall Street-caliber research, and insightful market analysis since 1998.


ETFOptimize | HOME
Close Window

Is Cognizant Technology Stock Underperforming the Nasdaq?

With a market cap of $39 billion, Cognizant Technology Solutions Corporation (CTSH) is a major global IT-services and consulting firm. Headquartered in Teaneck, New Jersey, it delivers a wide range of services, including IT consulting, digital transformation, cloud infrastructure, AI and automation, cybersecurity, business-process outsourcing, and enterprise systems integration. 

Companies valued at $10 billion or more are generally classified as “large-cap” stocks, and Cognizant fits this criterion perfectly. 


However, shares of the tech company have fallen 11.1% from its 52-week high of $90.82. Cognizant’s shares have decreased 12.4% over the past three months, underperforming the Nasdaq Composite’s ($NASX) 8.7% rise over the same time frame. 

www.barchart.com

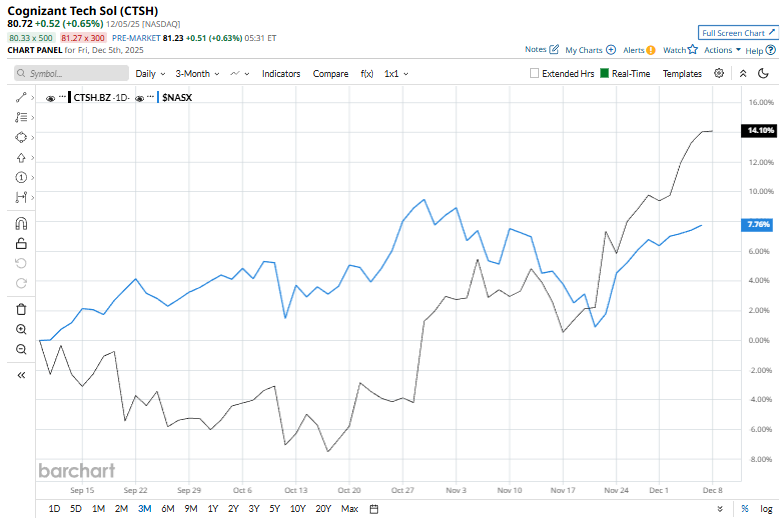
In the longer term, CTSH stock is down 5% on a YTD basis, lagging behind NASX’s nearly 22.1% rise. Moreover, shares of the company have dropped marginally over the past 52 weeks, compared to NASX’s 19.7% return over the same time frame.

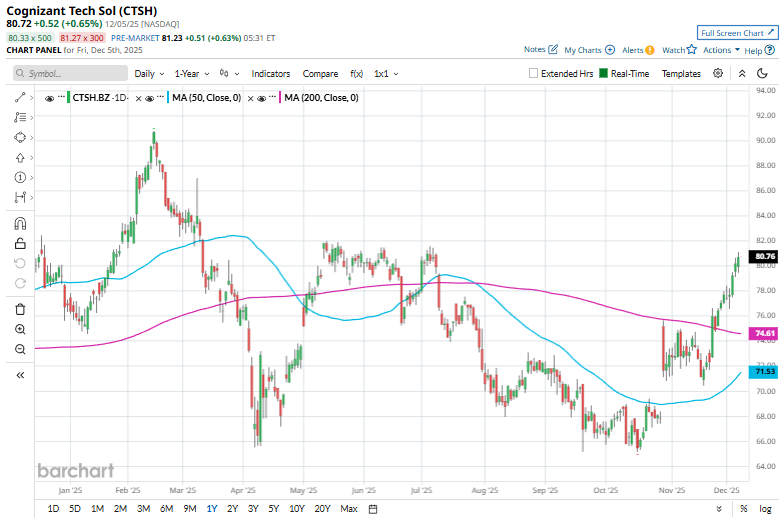
Despite the grim price action, the stock has been trading above its 50-day and 200-day moving averages since late October and late November, respectively. 

www.barchart.com

Following its Q3 2025 earnings release on Oct. 29, Cognizant shares surged 5.7%, driven by results that exceeded expectations, with adjusted EPS of $1.39 and revenue of $5.42 billion. The company boosted confidence further by raising its full-year adjusted earnings forecast to $5.22–$5.26 per share and lifting the lower end of its annual revenue outlook to $21.05 billion. Investor enthusiasm was additionally supported by the company’s strong AI-centric growth initiatives and rising enterprise investment in digital infrastructure.

Top rival, Broadridge Financial Solutions, Inc. (BR), has faced a similar fate. BR stock has gained over 2.6% on a YTD basis and has dwindled 1.7% over the past 52 weeks.

The stock has a consensus rating of “Moderate Buy” from the 24 analysts in coverage, and the mean price target of $85.52 is a premium of 5.9% to current levels.


On the date of publication, Kritika Sarmah did not have (either directly or indirectly) positions in any of the securities mentioned in this article. All information and data in this article is solely for informational purposes. For more information please view the Barchart Disclosure Policy here.


More news from Barchart

Recent Quotes

View More
Symbol Price Change (%)
AMZN  223.84
+1.28 (0.58%)
AAPL  273.35
-1.26 (-0.46%)
AMD  200.49
-8.68 (-4.15%)
BAC  54.97
+0.16 (0.28%)
GOOG  299.74
-7.99 (-2.60%)
META  657.66
+0.51 (0.08%)
MSFT  476.60
+0.21 (0.04%)
NVDA  171.15
-6.57 (-3.70%)
ORCL  178.93
-9.72 (-5.15%)
TSLA  476.26
-13.62 (-2.78%)
Stock Quote API & Stock News API supplied by www.cloudquote.io
Quotes delayed at least 20 minutes.
By accessing this page, you agree to the Privacy Policy and Terms Of Service.


IntelligentValue Home
Close Window

DISCLAIMER

All content herein is issued solely for informational purposes and is not to be construed as an offer to sell or the solicitation of an offer to buy, nor should it be interpreted as a recommendation to buy, hold or sell (short or otherwise) any security.  All opinions, analyses, and information included herein are based on sources believed to be reliable, but no representation or warranty of any kind, expressed or implied, is made including but not limited to any representation or warranty concerning accuracy, completeness, correctness, timeliness or appropriateness. We undertake no obligation to update such opinions, analysis or information. You should independently verify all information contained on this website. Some information is based on analysis of past performance or hypothetical performance results, which have inherent limitations. We make no representation that any particular equity or strategy will or is likely to achieve profits or losses similar to those shown. Shareholders, employees, writers, contractors, and affiliates associated with ETFOptimize.com may have ownership positions in the securities that are mentioned. If you are not sure if ETFs, algorithmic investing, or a particular investment is right for you, you are urged to consult with a Registered Investment Advisor (RIA). Neither this website nor anyone associated with producing its content are Registered Investment Advisors, and no attempt is made herein to substitute for personalized, professional investment advice. Neither ETFOptimize.com, Global Alpha Investments, Inc., nor its employees, service providers, associates, or affiliates are responsible for any investment losses you may incur as a result of using the information provided herein. Remember that past investment returns may not be indicative of future returns.

Copyright © 1998-2017 ETFOptimize.com, a publication of Optimized Investments, Inc. All rights reserved.