ETFOptimize | High-performance ETF-based Investment Strategies

Quantitative strategies, Wall Street-caliber research, and insightful market analysis since 1998.


ETFOptimize | HOME
Close Window

Is Deckers Outdoor Stock Underperforming the S&P 500?

Goleta, California-based Deckers Outdoor Corporation (DECK) is a leading designer, producer, and brand manager of innovative, niche footwear and accessories developed for outdoor sports and other lifestyle-related activities. With a market cap of $14.5 billion, Deckers' proprietary brands include UGG, HOKA, Teva, Sanuk, and Koolaburra.

Companies worth $10 billion or more are generally described as “large-cap stocks.” Deckers fits this bill perfectly. Given the company’s strong portfolio of well-known brands, its valuation above this mark is unsurprising.


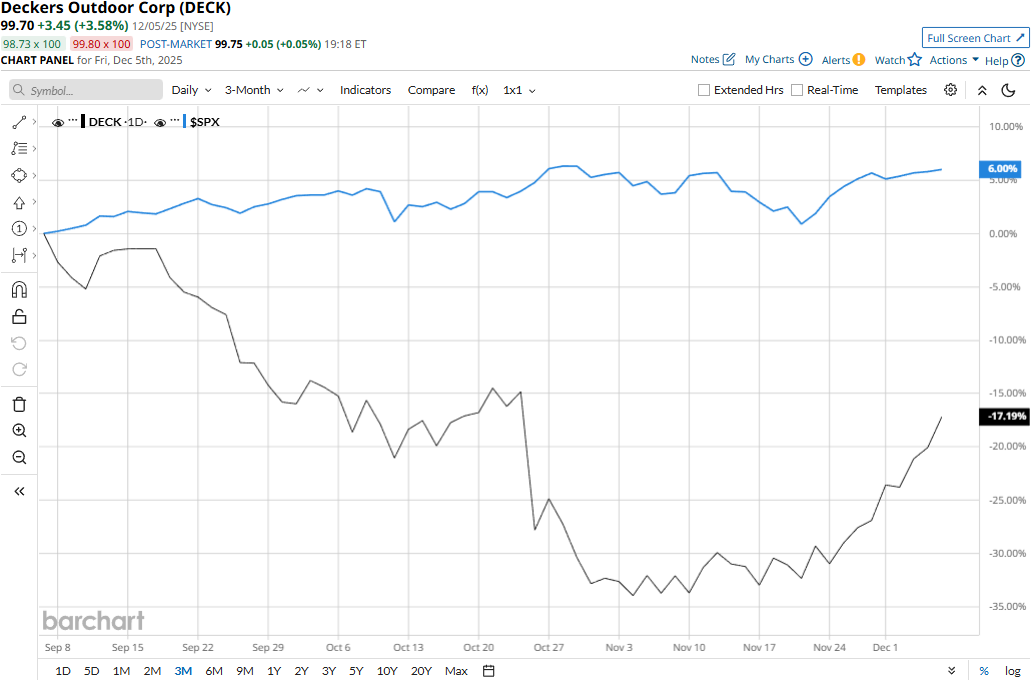
Despite its notable strengths, DECK stock has tanked 55.5% from its all-time high of $223.98 touched on Jan. 30. Meanwhile, the stock has declined 17.2% over the past three months, underperforming the S&P 500 Index's ($SPX6% uptick during the same time frame.

www.barchart.com

Deckers’ performance has remained grim over the longer term as well. DECK stock has plummeted 50.9% on a YTD basis and 50.4% over the past 52 weeks, compared to SPX’s 16.8% surge in 2025 and 13.1% returns over the past year.

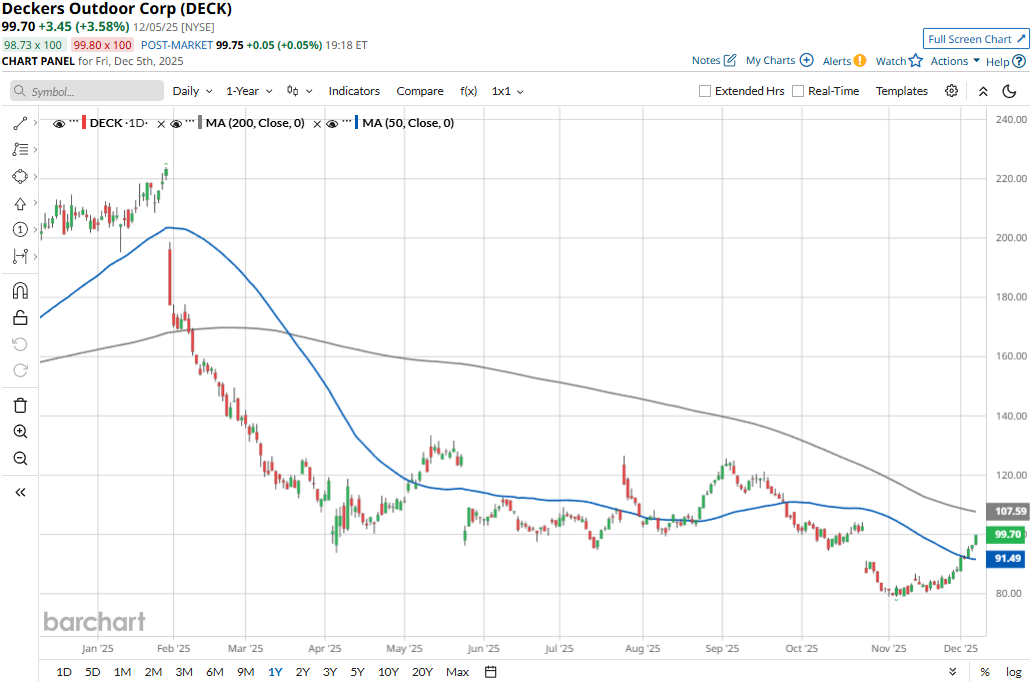
DECK stock has traded mostly below its 50-day moving average since late January, with some fluctuations, and consistently below its 200-day moving average since early February, underscoring its bearish trend.

www.barchart.com

Despite reporting better-than-expected results, Deckers Outdoor’s stock prices plunged 15.2% in the trading session following the release of its Q2 results on Oct. 23. The company reported a solid 9.1% year-over-year increase in revenues to $1.4 billion, beating the Street’s expectations by 1.2%. Meanwhile, its EPS grew 14.5% year-over-year to $1.82, surpassing the consensus estimates by a notable margin.

However, this growth came from a 13.4% increase in wholesale revenues, and the company’s DTC revenues dropped by 80 bps compared to the year-ago quarter, raising investor concern.

Further, Deckers has notably underperformed its peer, Skechers U.S.A., Inc.’s (SKX6.1% decline in 2025 and 3.8% drop over the past 52 weeks.

Among the 25 analysts covering the DECK stock, the consensus rating is a “Moderate Buy.” Its mean price target of $110.62 suggests an 11% upside potential from current price levels.


On the date of publication, Aditya Sarawgi did not have (either directly or indirectly) positions in any of the securities mentioned in this article. All information and data in this article is solely for informational purposes. For more information please view the Barchart Disclosure Policy here.


More news from Barchart

Recent Quotes

View More
Symbol Price Change (%)
AMZN  223.93
+1.37 (0.62%)
AAPL  273.13
-1.48 (-0.54%)
AMD  200.72
-8.45 (-4.04%)
BAC  54.65
-0.16 (-0.29%)
GOOG  300.53
-7.20 (-2.34%)
META  657.75
+0.60 (0.09%)
MSFT  478.76
+2.37 (0.50%)
NVDA  172.26
-5.46 (-3.07%)
ORCL  180.42
-8.23 (-4.36%)
TSLA  475.68
-14.20 (-2.90%)
Stock Quote API & Stock News API supplied by www.cloudquote.io
Quotes delayed at least 20 minutes.
By accessing this page, you agree to the Privacy Policy and Terms Of Service.


IntelligentValue Home
Close Window

DISCLAIMER

All content herein is issued solely for informational purposes and is not to be construed as an offer to sell or the solicitation of an offer to buy, nor should it be interpreted as a recommendation to buy, hold or sell (short or otherwise) any security.  All opinions, analyses, and information included herein are based on sources believed to be reliable, but no representation or warranty of any kind, expressed or implied, is made including but not limited to any representation or warranty concerning accuracy, completeness, correctness, timeliness or appropriateness. We undertake no obligation to update such opinions, analysis or information. You should independently verify all information contained on this website. Some information is based on analysis of past performance or hypothetical performance results, which have inherent limitations. We make no representation that any particular equity or strategy will or is likely to achieve profits or losses similar to those shown. Shareholders, employees, writers, contractors, and affiliates associated with ETFOptimize.com may have ownership positions in the securities that are mentioned. If you are not sure if ETFs, algorithmic investing, or a particular investment is right for you, you are urged to consult with a Registered Investment Advisor (RIA). Neither this website nor anyone associated with producing its content are Registered Investment Advisors, and no attempt is made herein to substitute for personalized, professional investment advice. Neither ETFOptimize.com, Global Alpha Investments, Inc., nor its employees, service providers, associates, or affiliates are responsible for any investment losses you may incur as a result of using the information provided herein. Remember that past investment returns may not be indicative of future returns.

Copyright © 1998-2017 ETFOptimize.com, a publication of Optimized Investments, Inc. All rights reserved.