ETFOptimize | High-performance ETF-based Investment Strategies

Quantitative strategies, Wall Street-caliber research, and insightful market analysis since 1998.


ETFOptimize | HOME
Close Window

Is ResMed Stock Underperforming the S&P 500?

With a market cap of $37.4 billion, San Diego, California-based ResMed Inc. (RMD) develops and markets medical devices and cloud-based software for diagnosing, treating, and managing respiratory disorders worldwide. The company operates through two segments: Sleep and Breathing Health, and Residential Care Software, offering solutions ranging from sleep diagnostics and therapy devices to comprehensive healthcare software platforms. 

Companies valued at $10 billion or more are generally classified as “large-cap” stocks, and ResMed fits this criterion perfectly. Its innovations include portable diagnostic tools, cloud-based monitoring systems, and enterprise software solutions supporting sleep clinics, home medical equipment providers, and senior care organizations.


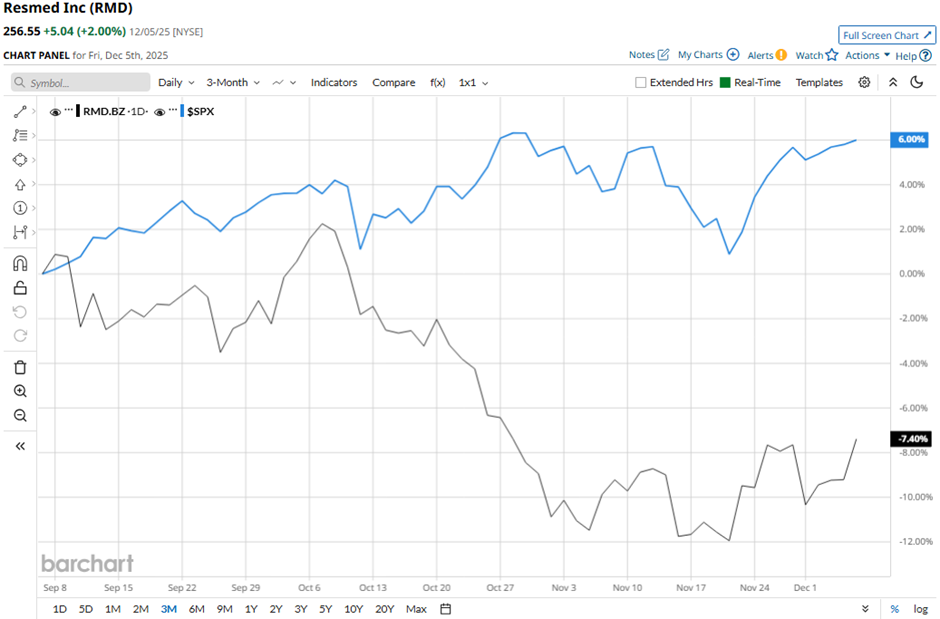
Shares of the medical products maker have fallen 12.7% from its 52-week high of $293.81. RMD stock has declined 7.4% over the past three months, lagging behind the broader S&P 500 Index’s ($SPX) 6% increase over the same time frame.

www.barchart.com

In the longer term, RMD stock is up 12.2% on a YTD basis, underperforming the SPX’s 16.8% gain. Moreover, shares of ResMed have increased 7.2% over the past 52 weeks, compared to the 13.1% return of the SPX over the same time frame.

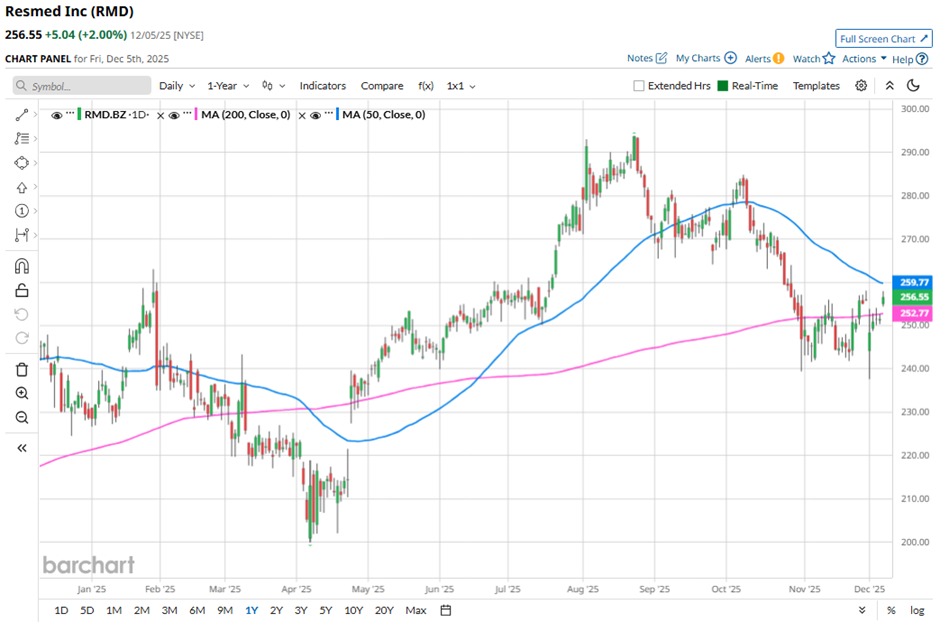
Despite few fluctuations, the stock has been trading below its 50-day moving average since September. 

www.barchart.com

ResMed posted strong Q1 2026 results on Oct. 30, including 9% revenue growth to $1.34 billion, 280 bps adjusted gross-margin expansion, and 16% adjusted EPS growth to $2.55, signaling accelerating profitability and operational strength. Investor sentiment was further boosted by $457 million in operating cash flow, continued share repurchases and dividends, and management’s confidence in sustained growth supported by rising global sleep-health demand. However, the stock fell 2.1% the next day.

In comparison, ResMed stock has outperformed its rival, Intuitive Surgical, Inc. (ISRG). ISRG stock has gained 5.1% over the past 52 weeks and 10.2% on a YTD basis. 

Despite RMD’s underperformance relative to SPX, analysts remain moderately optimistic about its prospects. The stock has a consensus rating of “Moderate Buy” from the 19 analysts covering the stock, and the mean price target of $291.31 is a premium of 13.5% to current levels. 


On the date of publication, Sohini Mondal did not have (either directly or indirectly) positions in any of the securities mentioned in this article. All information and data in this article is solely for informational purposes. For more information please view the Barchart Disclosure Policy here.


More news from Barchart

Recent Quotes

View More
Symbol Price Change (%)
AMZN  223.81
+1.25 (0.56%)
AAPL  273.32
-1.29 (-0.47%)
AMD  200.31
-8.86 (-4.24%)
BAC  54.97
+0.16 (0.28%)
GOOG  299.51
-8.22 (-2.67%)
META  657.52
+0.37 (0.06%)
MSFT  476.56
+0.17 (0.04%)
NVDA  171.08
-6.64 (-3.74%)
ORCL  178.82
-9.83 (-5.21%)
TSLA  475.82
-14.06 (-2.87%)
Stock Quote API & Stock News API supplied by www.cloudquote.io
Quotes delayed at least 20 minutes.
By accessing this page, you agree to the Privacy Policy and Terms Of Service.


IntelligentValue Home
Close Window

DISCLAIMER

All content herein is issued solely for informational purposes and is not to be construed as an offer to sell or the solicitation of an offer to buy, nor should it be interpreted as a recommendation to buy, hold or sell (short or otherwise) any security.  All opinions, analyses, and information included herein are based on sources believed to be reliable, but no representation or warranty of any kind, expressed or implied, is made including but not limited to any representation or warranty concerning accuracy, completeness, correctness, timeliness or appropriateness. We undertake no obligation to update such opinions, analysis or information. You should independently verify all information contained on this website. Some information is based on analysis of past performance or hypothetical performance results, which have inherent limitations. We make no representation that any particular equity or strategy will or is likely to achieve profits or losses similar to those shown. Shareholders, employees, writers, contractors, and affiliates associated with ETFOptimize.com may have ownership positions in the securities that are mentioned. If you are not sure if ETFs, algorithmic investing, or a particular investment is right for you, you are urged to consult with a Registered Investment Advisor (RIA). Neither this website nor anyone associated with producing its content are Registered Investment Advisors, and no attempt is made herein to substitute for personalized, professional investment advice. Neither ETFOptimize.com, Global Alpha Investments, Inc., nor its employees, service providers, associates, or affiliates are responsible for any investment losses you may incur as a result of using the information provided herein. Remember that past investment returns may not be indicative of future returns.

Copyright © 1998-2017 ETFOptimize.com, a publication of Optimized Investments, Inc. All rights reserved.