Valued at a market cap of $36.7 billion, Westinghouse Air Brake Technologies Corporation (WAB) provides technology-based locomotives, equipment, systems, and services for the freight rail and passenger transit industries. It is based in Pittsburgh, Pennsylvania.
Companies worth $10 billion or more are typically classified as “large-cap stocks,” and WAB fits the label perfectly, with its market cap exceeding this threshold, underscoring its size, influence, and dominance within the railroad industry. The company’s key strengths include its deep engineering expertise, long-standing customer relationships with major rail operators, and a large installed base that drives recurring aftermarket revenue for parts and services.
This railroad company is currently trading marginally below its 52-week high of $216.10, reached on Jul. 8. Shares of WAB have gained 12.6% over the past three months, outperforming the S&P 500 Index’s ($SPX) 5.7% rise during the same time frame.
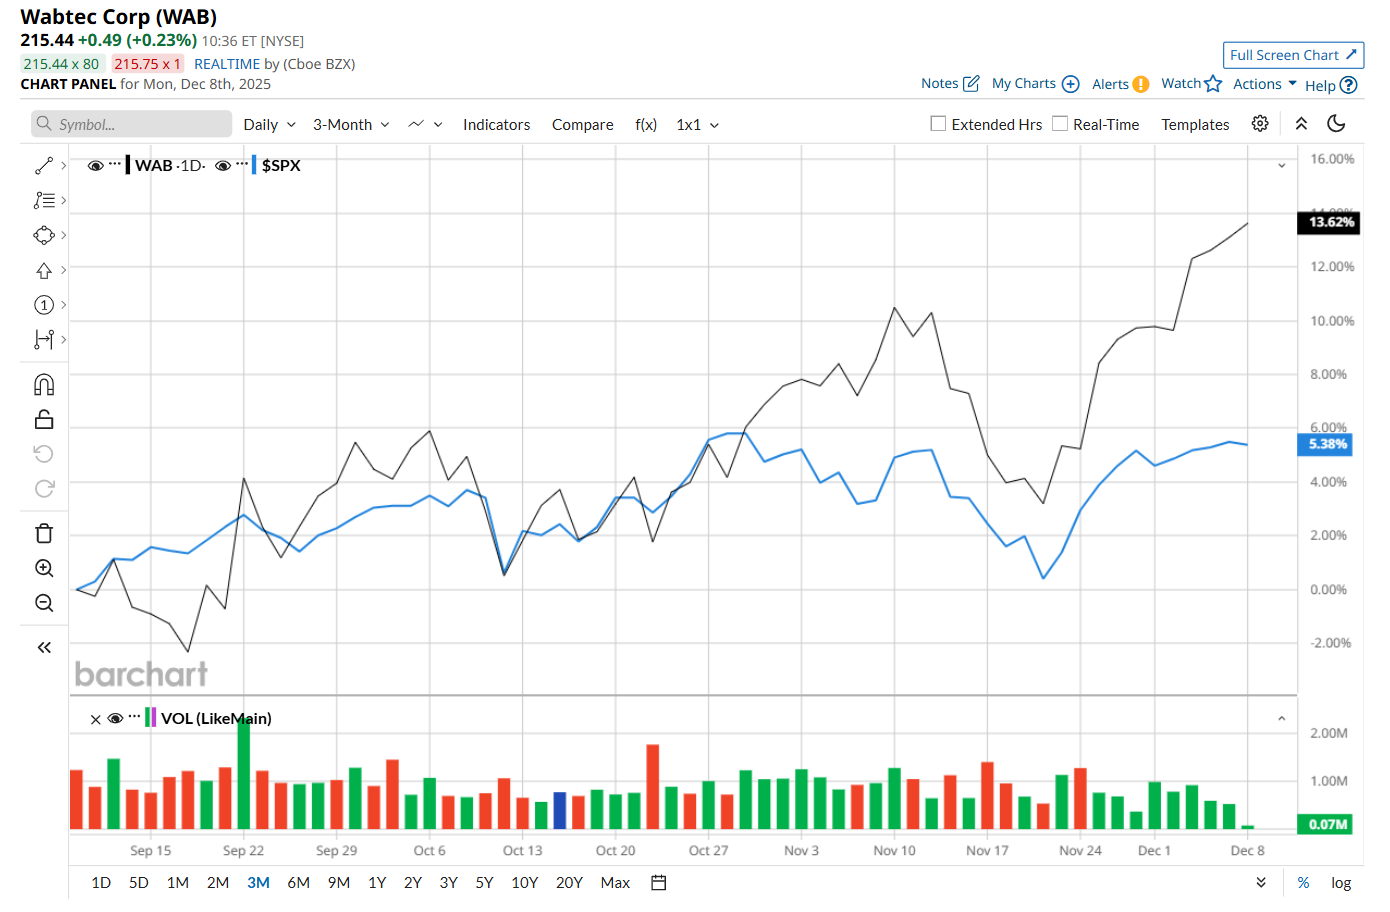
However, on a YTD basis, shares of WAB are up 13.4%, lagging behind SPX’s 16.7% return. Moreover, in the longer term, WAB has surged 4.6% over the past 52 weeks, compared to SPX’s 12.7% uptick over the same time frame.
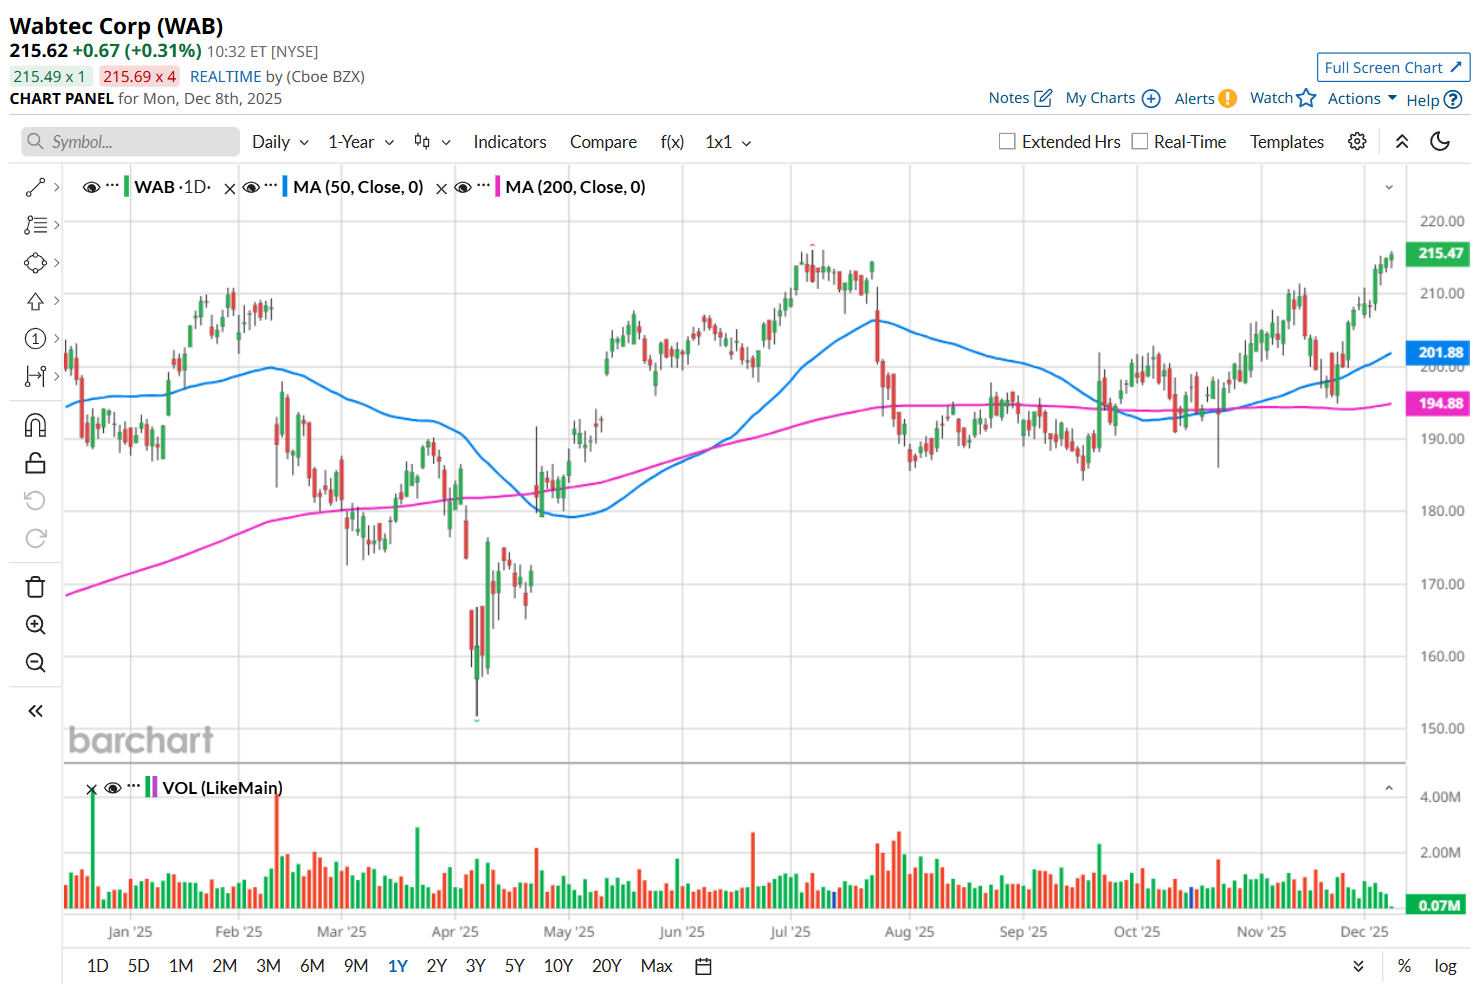
To confirm its recent bullish trend, WAB has been trading above its 200-day and 50-day moving averages since late September, with slight fluctuations.
On Oct. 22, WAB reported better-than-expected Q3 results. The company’s revenue grew 8.4% year-over-year to $2.9 billion, surpassing consensus estimates by a slight margin. Moreover, on the earnings front, its adjusted EPS increased 16% from the year-ago quarter to $2.32, topping analyst expectations of $2.23. However, despite the solid beat, the stock plunged 2.3% after the earnings release.
WAB has outpaced its rival, Trinity Industries, Inc. (TRN), which declined 26.4% over the past 52 weeks and 20.3% on a YTD basis.
Looking at WAB’s recent outperformance, analysts remain moderately optimistic about its prospects. The stock has a consensus rating of "Moderate Buy” from the 13 analysts covering it, and the mean price target of $229.54 suggests a 6.6% premium to its current price levels.
On the date of publication, Neharika Jain did not have (either directly or indirectly) positions in any of the securities mentioned in this article. All information and data in this article is solely for informational purposes. For more information please view the Barchart Disclosure Policy here.
More news from Barchart
- A $1.5 Billion Catalyst Just Rocked SoFi Stock. Should You Buy, Sell, or Hold Shares Here?
- Is a Global Margin Call Coming? How a Bank of Japan Rate Hike Could Trigger the Next Market Shock
- As Palantir Announces a TWG Partnership, Should You Buy, Sell, or Hold PLTR Stock?
- A Short Squeeze Could Send This Little-Known Biotech Stock Soaring


