ETFOptimize | High-performance ETF-based Investment Strategies

Quantitative strategies, Wall Street-caliber research, and insightful market analysis since 1998.


ETFOptimize | HOME
Close Window

Is Xcel Energy Stock Underperforming the S&P 500?

Xcel Energy Inc. (XEL), headquartered in Minneapolis, Minnesota, generates, purchases, transmits, distributes, and sells electricity. With a market cap of $45.7 billion, the company also purchases, transports, distributes, and sells natural gas to retail customers, as well as transports customer-owned natural gas. 

Companies worth $10 billion or more are generally described as “large-cap stocks,” and XEL perfectly fits that description, with its market cap exceeding this mark, underscoring its size, influence, and dominance within the utilities - regulated electric industry. XEL stands out for its substantial renewable energy portfolio, with over half its electricity sales derived from carbon-free sources, aligning with global sustainability trends and appealing to eco-conscious consumers. A significant strength lies in its ability to recover capital-intensive infrastructure investments through regulatory mechanisms, thereby ensuring financial stability and supporting steady revenue growth.


Despite its notable strength, XEL slipped 7% from its 52-week high of $83.01, achieved on Oct. 16. Over the past three months, XEL stock has gained 6.2%, outperforming the S&P 500 Index’s ($SPX6% gains during the same time frame.

www.barchart.com

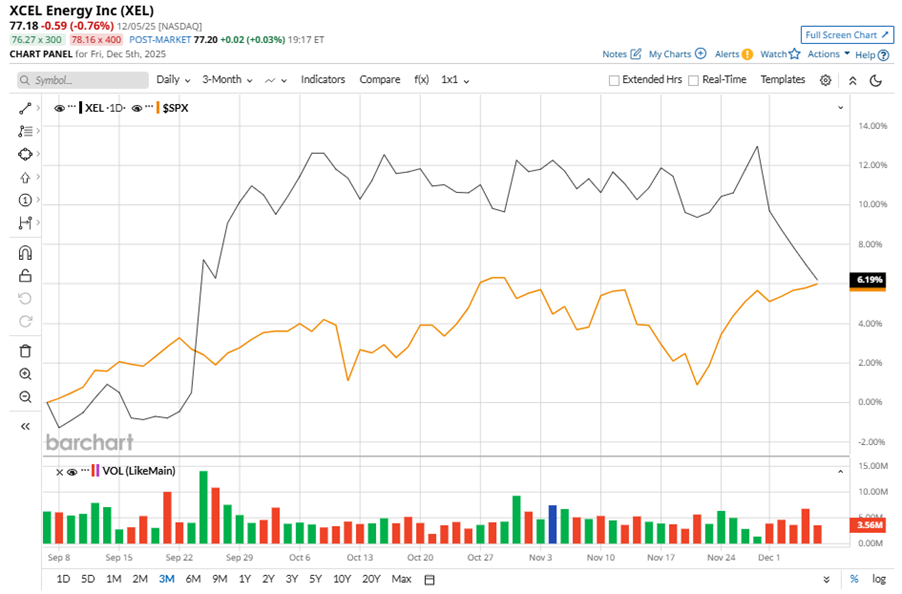
In the longer term, shares of XEL rose 12.6% on a six-month basis and climbed 8.9% over the past 52 weeks, underperforming SPX’s six-month gains of 15.7% and 13.1% returns over the last year.

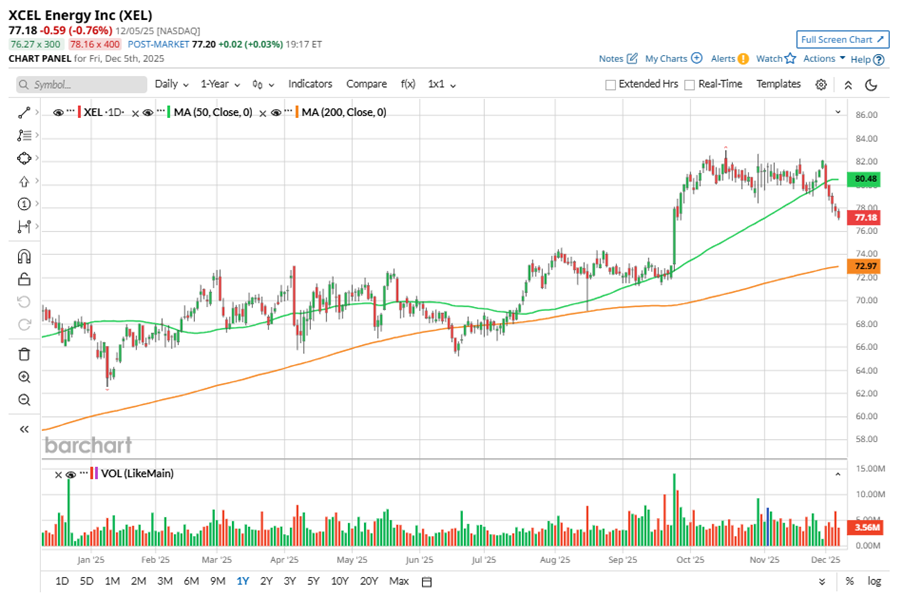
To confirm the bullish trend, XEL has been trading above its 200-day moving average over the past year, with slight fluctuations. However, the stock has been trading below its 50-day moving average recently.

www.barchart.com

On Oct. 30, XEL shares closed up more than 2% after reporting its Q3 results. Its adjusted EPS of $1.24 fell short of Wall Street expectations of $1.31. The company’s revenue was $3.92 billion, falling short of Wall Street's $3.93 billion forecast. XEL expects full-year adjusted EPS in the range of $3.75 to $3.85.

In the competitive arena of utilities - regulated electric, American Electric Power Company, Inc. (AEP) has taken the lead over XEL, showing resilience with a 15.8% uptick on a six-month basis and solid 23% gains over the past 52 weeks.

Wall Street analysts are bullish on XEL’s prospects. The stock has a consensus “Strong Buy” rating from the 18 analysts covering it, and the mean price target of $89.75 suggests a potential upside of 16.3% from current price levels.


On the date of publication, Neha Panjwani did not have (either directly or indirectly) positions in any of the securities mentioned in this article. All information and data in this article is solely for informational purposes. For more information please view the Barchart Disclosure Policy here.


More news from Barchart

Recent Quotes

View More
Symbol Price Change (%)
AMZN  223.85
+1.29 (0.58%)
AAPL  273.25
-1.36 (-0.49%)
AMD  200.57
-8.60 (-4.11%)
BAC  54.98
+0.16 (0.30%)
GOOG  299.63
-8.10 (-2.63%)
META  657.55
+0.40 (0.06%)
MSFT  476.64
+0.25 (0.05%)
NVDA  171.15
-6.57 (-3.70%)
ORCL  179.05
-9.60 (-5.09%)
TSLA  475.94
-13.94 (-2.85%)
Stock Quote API & Stock News API supplied by www.cloudquote.io
Quotes delayed at least 20 minutes.
By accessing this page, you agree to the Privacy Policy and Terms Of Service.


IntelligentValue Home
Close Window

DISCLAIMER

All content herein is issued solely for informational purposes and is not to be construed as an offer to sell or the solicitation of an offer to buy, nor should it be interpreted as a recommendation to buy, hold or sell (short or otherwise) any security.  All opinions, analyses, and information included herein are based on sources believed to be reliable, but no representation or warranty of any kind, expressed or implied, is made including but not limited to any representation or warranty concerning accuracy, completeness, correctness, timeliness or appropriateness. We undertake no obligation to update such opinions, analysis or information. You should independently verify all information contained on this website. Some information is based on analysis of past performance or hypothetical performance results, which have inherent limitations. We make no representation that any particular equity or strategy will or is likely to achieve profits or losses similar to those shown. Shareholders, employees, writers, contractors, and affiliates associated with ETFOptimize.com may have ownership positions in the securities that are mentioned. If you are not sure if ETFs, algorithmic investing, or a particular investment is right for you, you are urged to consult with a Registered Investment Advisor (RIA). Neither this website nor anyone associated with producing its content are Registered Investment Advisors, and no attempt is made herein to substitute for personalized, professional investment advice. Neither ETFOptimize.com, Global Alpha Investments, Inc., nor its employees, service providers, associates, or affiliates are responsible for any investment losses you may incur as a result of using the information provided herein. Remember that past investment returns may not be indicative of future returns.

Copyright © 1998-2017 ETFOptimize.com, a publication of Optimized Investments, Inc. All rights reserved.