From the end of September through the end of October, soybean futures rallied nearly $1, indicating strong noncommercial buying interest.
At the same time, futures spreads covered less calculated full commercial carry indicating the commercial side was also providing support.
Don’t Miss a Day: From crude oil to coffee, sign up free for Barchart’s best-in-class commodity analysis.As US government numbers are being released, in an attempt to catch up before the next shutdown at the end of January 2026, we see confirmation of what we already knew by watching the market.
What do we know about the US soybean market? Perhaps a more fitting question would be what DID we know about the US soybean market, particularly toward the end of October 2025. Recall the US government had been shut down on October 1, leaving those who can do nothing but regurgitate government numbers and call it “analysis” and/or “commentary” completely in the dark. On the other hand, those of us who actually analyze market activity, and comment on such, saw the US soybean market get more interesting leading up to this year’s All Hallows Eve, aka Halloween, as October ended.
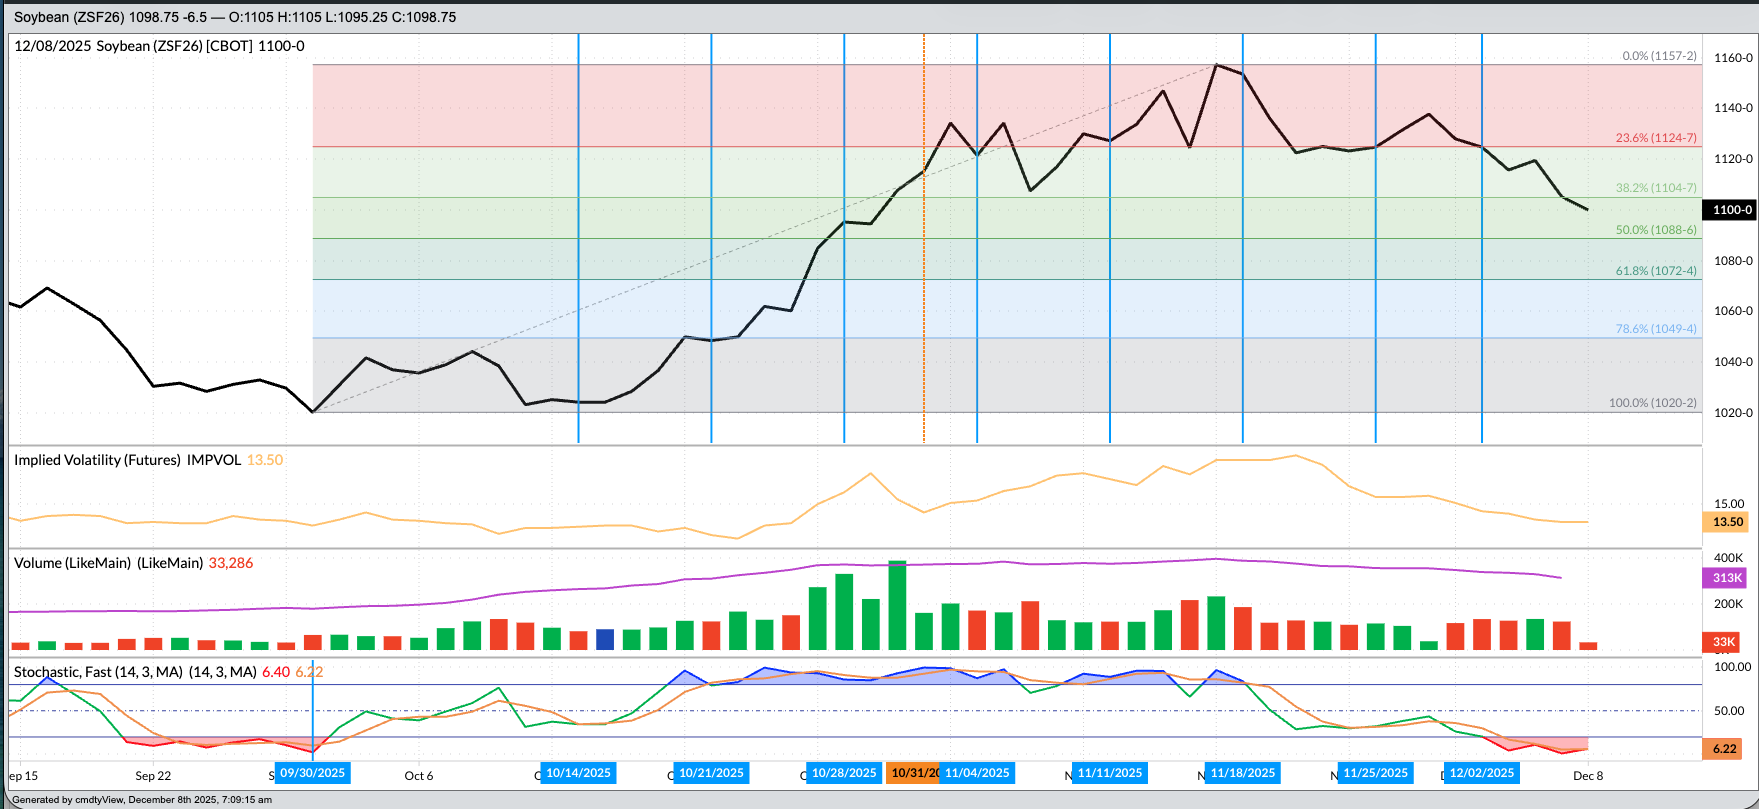
Let’s start with a little technical analysis. What I mean by this is a look at the trend of the futures market, which to me is nothing more than price direction over time. From the last daily close of September (Tuesday, September 30) through the last daily close of October (Friday, October 31), the January futures contract (ZSF26) gained 95.0 cents. Additionally, total open interest in soybeans initially grew from 932,138 contracts at the close of business on September 30 to a high of 981,616 on Friday, October 10. This tells us someone was doing some buying while Washington, D.C. was dark. But who?
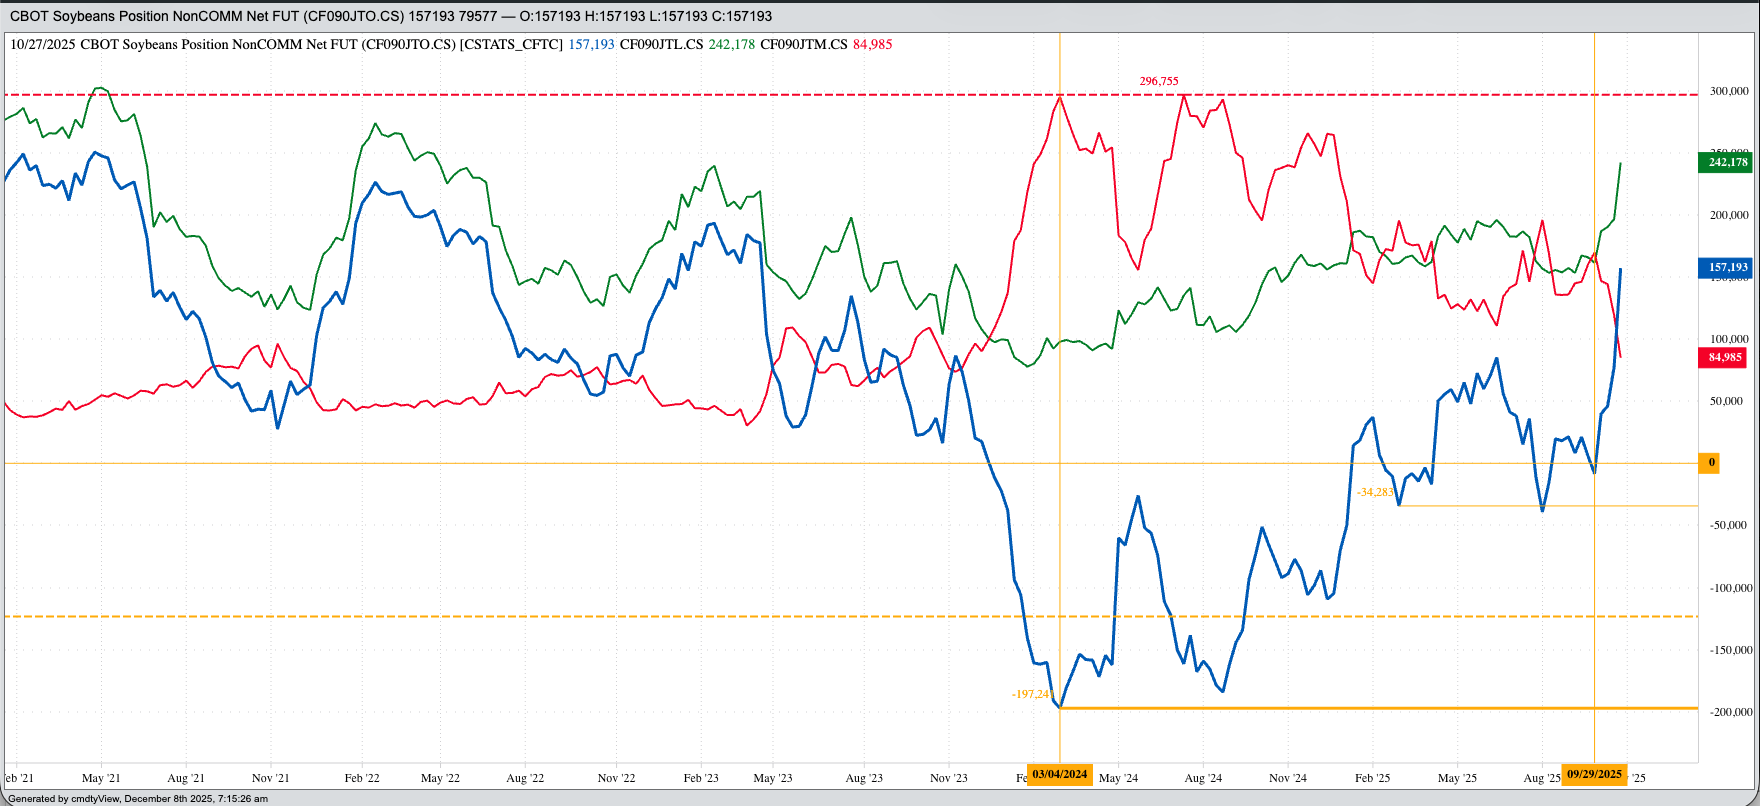
Since the lights were turned back on November 13, the shutdown lasting a record 43 days, US government agencies have been trying to catch up with report releases ahead of the next shutdown scheduled to begin on January 31. A look at the CFTC Commitments of Traders updates (legacy, futures only) that have been released and we get a better picture of who, or what, was buying. As of Tuesday, September 30, the noncommercial (funds, algorithms, aka Watson) net futures position was short 8,333 contracts. This included:
- Long futures positions of 161,500 contracts, a weekly decrease of 4,444 contracts, and
- Short futures positions of 169,833 contracts, a weekly increase of 9,637 contracts
Once the calendar page turned to October, these positions immediately showed a dramatic change. The latest update, for the week ending Tuesday, October 28, showed Watson held a net-long futures position of 157,193 contracts, an increase of 79,577 contracts.
- This included an increase in long futures of 45,520 contracts
- And a decrease in short futures by 34,057 contracts
- This was the largest net-long futures position in soybeans since 177,510 contracts the week of April 18, 2023
- The long futures position 242,178 contracts was the largest since 249,273 contracts the week of April 26, 2022
- The short futures position of 84,895 contracts was the smallest since 76,762 contracts the week of November 21, 2023
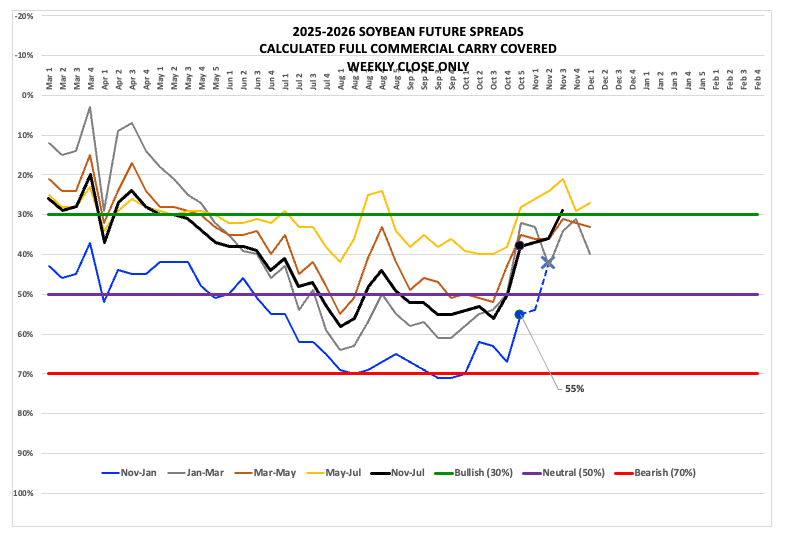
Like the Moonflower, commercial buying had bloomed in the darkness. Recall again the lights were out at the US government, literally this time instead of just figuratively. A look at soybean futures spreads the last weekly close of September and we see:
- The Nov25-Jan26 covered 71% calculated full commercial carry (cfcc) as compared to 58% by the Nov24-Jan25 the same week the previous year, meaning the commercial outlook was more bearish.
- The Jan26-Mar26 covered 61% versus the previous year’s 42%
- The Mar26-May26 covered 51% versus 40% (keeping in mind the March-May spread is our read on Brazil’s next crop)
- And the May26-Jul26 covered 36% versus the previous year’s 29%
The bottom line was the commercial view of supply and demand was more bearish than a year ago. However, if we fast forward to the last weekly close of October, the picture changes:
- The Nov25-Jan26 covered 55% as compared to 40% the previous year, telling us the US still had ample supplies on hand for immediate demand. However,
- The Jan26-Mar26 covered 32% versus the previous year’s 53%
- The Mar26-May26 covered 35% versus 59% (keeping in mind the March-May spread is our read on Brazil’s next crop)
- And the May26-Jul26 covered 28% versus the previous year’s 45%
This tells us the commercial side provided as much support, if not more, than Watson. The next question, though, was how much of this was for physical supplies of US bushels versus futures only? Recall the latest much-ballyhooed “deal” between the US and China reportedly included a caveat that the latter could fulfill its requirement in the futures market rather than buying physical US supplies.
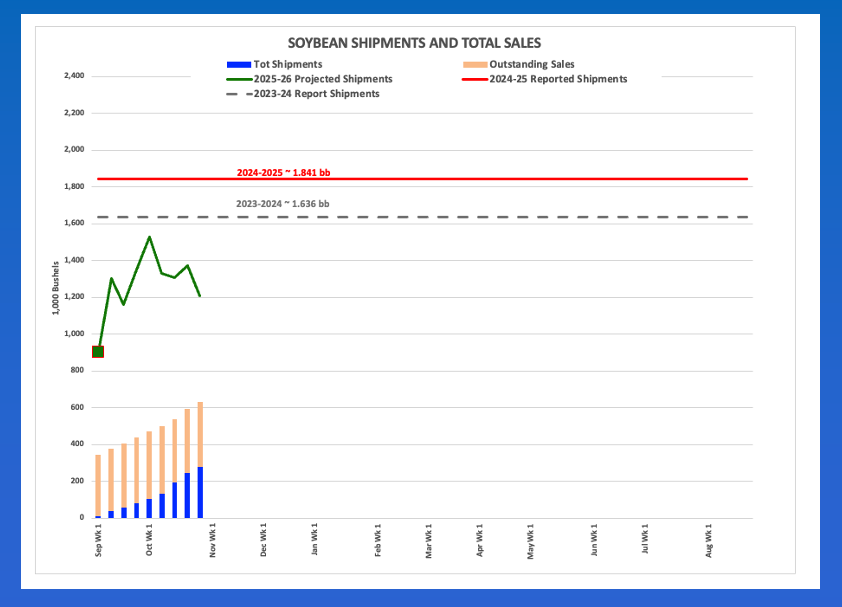
A look at weekly export sales and shipments updates, and we see as of Thursday, September 25 China had no US supplies on the books, and the US had shipped a total of 81 million bushels. Given the US shipped an average of 6% of its marketing year total at that point, the pace projection for total marketing year export demand was 1.35 bb, down 27% from reported shipments of 1.841 bb for the 2024-2025 marketing year.
Fast forward to the update for the week ending Thursday, October 30, and we see the US had shipped 278 mb, a pace projecting total marketing year export shipments of 1.209 bb, down 34 mb. However, the updated also showed China had 232,000 mt (8.5 mb), the world’s largest buyer’s first purchases of secondary supplies from the US this marketing year. But again, we knew this had likely happened by watching market action during October.
Once the lights came back on in November, USDA has announced additional purchases of secondary supplies by China. However, it is interesting to note that once the US government shutdown ended on November 13, the January futures contract has fallen from a high daily close of $11.5725 (November 17) to last $11.00 early Monday morning.
What, then, do we know about the US soybean market? Watson is likely selling again, and China doesn’t like buying from the US when the lights are on. We’ll see what happens.
On the date of publication, Darin Newsom did not have (either directly or indirectly) positions in any of the securities mentioned in this article. All information and data in this article is solely for informational purposes. For more information please view the Barchart Disclosure Policy here.
More news from Barchart