With a market cap of $26.2 billion, Dover Corporation (DOV) is a global provider of equipment, components, software, and services across diverse industries. Its operations span five segments: Engineered Products, Clean Energy & Fueling, Imaging & Identification, Pumps & Process Solutions, and Climate & Sustainability Technologies, offering solutions for automotive, aerospace, industrial, and consumer markets.
Companies valued at $10 billion or more are generally considered “large-cap” stocks, and Dover fits this criterion perfectly. The company delivers innovative technologies and services for fluid handling, refrigeration, product traceability, fueling, and industrial processing applications worldwide.
DOV stock has decreased nearly 14% from its 52-week high of $222.31. Shares of the Downers Grove, Illinois-based company have increased 7.5% over the past three months, outpacing the Industrial Select Sector SPDR Fund’s (XLI) 2.1% rise over the same time frame.
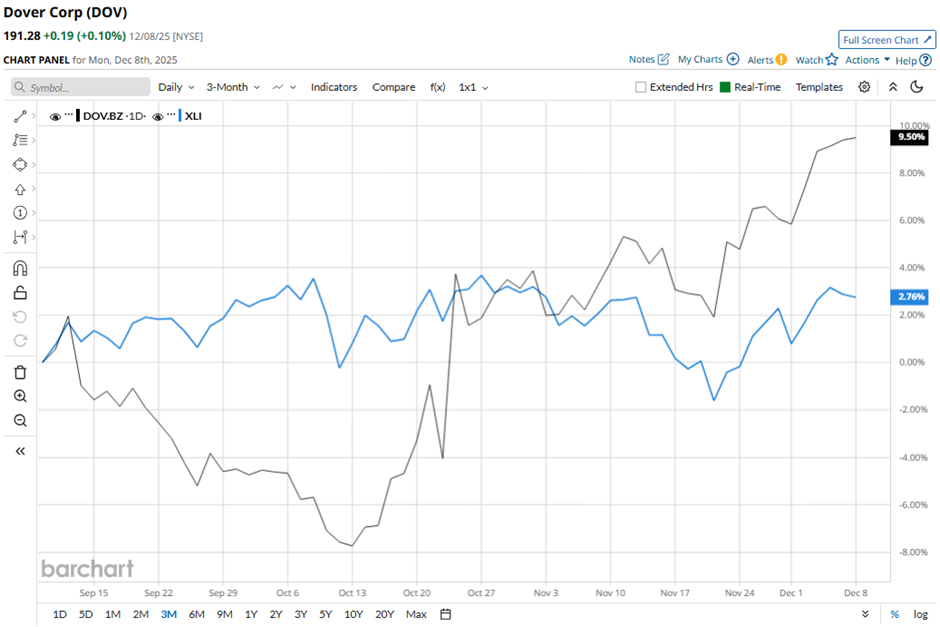
In the longer term, DOV stock is up nearly 2% on a YTD basis, lagging behind XLI’s 17.2% gain. Moreover, shares of Dover have declined 5.1% over the past 52 weeks, compared to XLI’s 9.8% return over the same time frame.
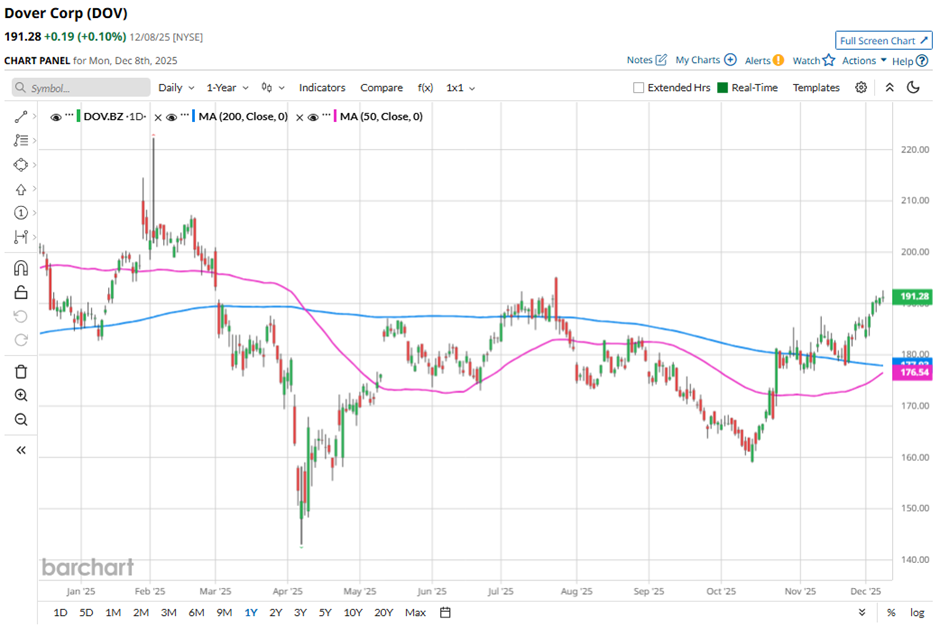
Yet, the stock has been trading above its 50-day moving average since late October.
Shares of DOV climbed 8.1% on Oct. 23 because the company delivered stronger-than-expected operating results, including 5% revenue growth and a 15% increase in adjusted EPS to $2.62 in Q3 2025. Investors also reacted positively to Dover’s robust order momentum, record consolidated segment margins, and 16% year-to-date growth in adjusted earnings. Confidence further improved after management raised full-year adjusted EPS guidance to $9.50 - $9.60.
In comparison, DOV stock has outpaced its rival, Illinois Tool Works Inc. (ITW). ITW stock has dropped 2.1% on a YTD basis and 9.3% over the past 52 weeks.
Despite DOV’s outperformance relative to its industry peers, analysts remain cautiously optimistic about its prospects. The stock has a consensus rating of “Moderate Buy” from the 18 analysts covering it, and the mean price target of $215.18 suggests a premium of 12.5% to its current levels.
On the date of publication, Sohini Mondal did not have (either directly or indirectly) positions in any of the securities mentioned in this article. All information and data in this article is solely for informational purposes. For more information please view the Barchart Disclosure Policy here.
More news from Barchart
- Protect Your Babies and Your Portfolios with This ‘Strong Buy’ Stock
- Even If There Is an AI Bubble, Wall Street Says You Should Keep Buying This Magnificent 7 Stock
- Nvidia Just Gave Its CUDA Platform a Major Revamp. Will That Move the Needle for NVDA Stock?
- Dear Carvana Stock Fans, Mark Your Calendars for December 22