New York-based International Flavors & Fragrances Inc. (IFF) is a global ingredients and specialty-solutions company. Valued at a market cap of $16.7 billion, the company formulates sensory and functional solutions that enhance taste, smell, texture, and nutrition in everyday products.
Companies valued at $10 billion or more are typically classified as “large-cap stocks,” and IFF fits the label perfectly, with its market cap exceeding this threshold, underscoring its size, influence, and dominance within the specialty chemicals industry. With a broad customer base and a global R&D network, the company plays a central role in enabling leading brands to create differentiated and consumer-preferred products.
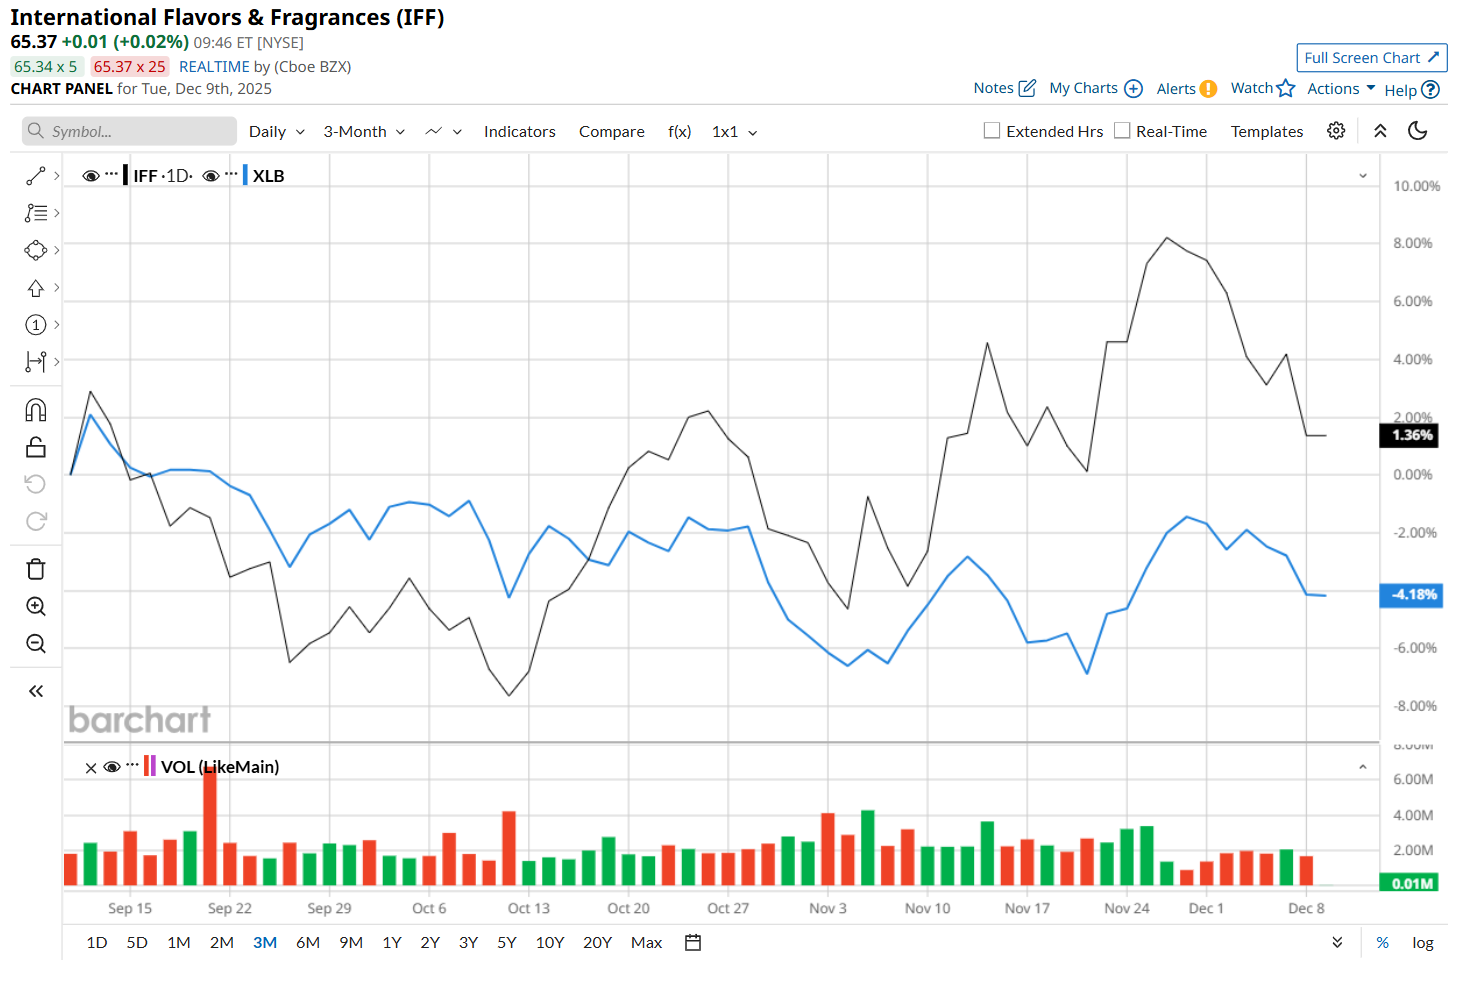
This specialty-solutions provider has slipped 27.9% below its 52-week high of $90.64, reached on Dec. 9, 2024. Shares of IFF have declined 1.2% over the past three months, outperforming the State Street Materials Select Sector ETF’s (XLB) 3.9% drop during the same time frame.
However, in the longer term, IFF has fallen 26.5% over the past 52 weeks, lagging behind XLB’s 5.3% loss over the same time frame. Moreover, on a YTD basis, shares of IFF are down 22.7%, compared to XLB’s 3.4% return.
To confirm its recent bullish trend, IFF has been trading above its 50-day moving average since early November. However, it has remained below its 200-day moving average over the past year.
On Nov. 4, IFF posted better-than-expected Q3 results, prompting its shares to surge 4.1% in the following trading session. The company’s net sales declined 7.9% year-over-year to $2.7 billion, but topped analyst expectations by 2.3%. Meanwhile, IFF’s productivity and cost-efficiency initiatives drove solid margin expansion, which helped offset lower sales. As a result, its adjusted EPS rose nearly 1% from the prior-year quarter to $1.05, exceeding consensus estimates by 2.9%.
IFF has considerably lagged behind its rival, Ecolab Inc. (ECL), which gained 3.4% over the past 52 weeks and 10% on a YTD basis.
Given IFF’s recent outperformance, analysts remain moderately optimistic about its prospects. The stock has a consensus rating of "Moderate Buy” from the 20 analysts covering it, and the mean price target of $80.61 suggests a 22.8% premium to its current price levels.
On the date of publication, Neharika Jain did not have (either directly or indirectly) positions in any of the securities mentioned in this article. All information and data in this article is solely for informational purposes. For more information please view the Barchart Disclosure Policy here.
More news from Barchart
- Down 8% in December, Investors Should Wait Until Late January to Buy Harley-Davidson
- Protect Your Babies and Your Portfolios with This ‘Strong Buy’ Stock
- Even If There Is an AI Bubble, Wall Street Says You Should Keep Buying This Magnificent 7 Stock
- Nvidia Just Gave Its CUDA Platform a Major Revamp. Will That Move the Needle for NVDA Stock?