Microsoft Corp (MSFT) stock still looks cheap here. One way to play it is to Short cash-secured MSFT puts that expire in one month. That provides a good way to set a lower buy-in and also make a 1.1% one-month yield.
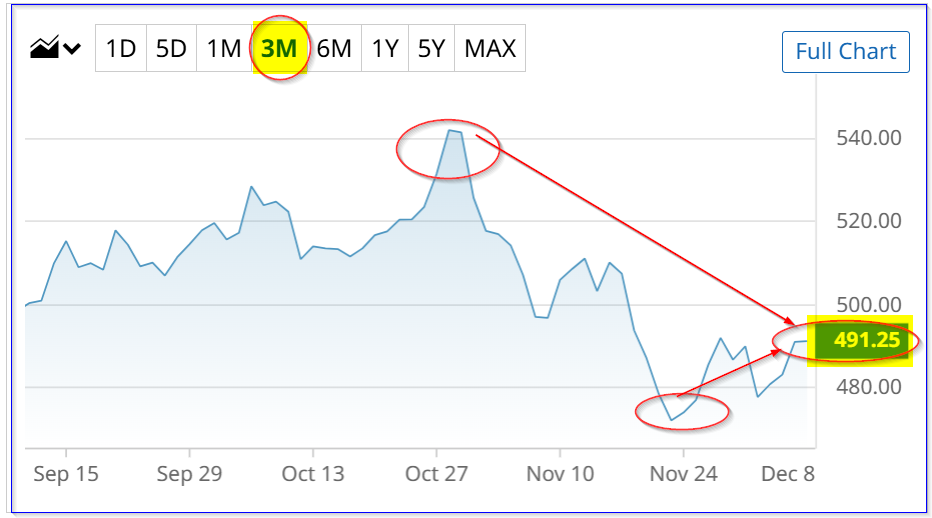
MSFT is trading at $491.54 in midday trading today. That's well off its recent peak of $542.07 on Oct. 28, but just up from a recent low of $472.12 on Nov. 21.
Based on my analysis in my Nov. 4 Barchart article ("Microsoft Produces Strong FCF As Expected - Shorting OTM Puts is an Attractive Play"), MSFT could be worth $682.55 per share. That's based on its strong free cash flow (FCF) and FCF margins.
In that article, I discussed shorting MSFT cash-secured puts that expired on Dec. 5 at the $500.00 strike price. The investor received $7.10 in premium, for a 1.42% one-month yield (i.e., $7.10/$500.00).
Moreover, the breakeven point was $492.90, after receipt of $7.10 in income. That's about where MSFT stock is today.
This short-put trade can now be repeated.
Shorting Cash-Secured OTM MSFT Puts
For example, the Jan. 9, 2026, expiry period shows that the midpoint premium at the $475.00 put option strike price is $5.63. This strike price is $16.54 below today's trading price - i.e., 3.36% out-of-the-money
That provides an investor who secures $47,500 in cash with their brokerage firm a potential buy-in at $475.00. In return, they receive the $563 in income immediately in their account.
That works out to a short-put yield of 1.185% (i.e., $5.63/$475.00).

This also means that the potential breakeven buy-in is much lower:
$475.00 - $5.63 = $469.37
That is 4.5% below today's price. In other words, it provides good downside protection along with immediate income.
In fact, over the last 2 months, the investor would have received $12.73 in income ($7.10 last month + $5.63 this month).
That means the total yield has been 2.68% (i.e., $12.73 / $475.00) over the last 2 months, and the net breakeven is now $462.73 ($575-$12.73). That's 5.76% below today's price.
Therefore, as long as MSFT stays roughly in this trading range, it makes sense to short these out-of-the-money (OTM) puts for a long-term investor.
That way, they can make a good income and also set a lower potential buy-in point.
The bottom line is that MSFT stock still looks cheap here. Shorting cash-secured puts in one-month expiry periods provides at least a 1.1% monthly income and sets a lower potential buy-in point.
On the date of publication, Mark R. Hake, CFA did not have (either directly or indirectly) positions in any of the securities mentioned in this article. All information and data in this article is solely for informational purposes. For more information please view the Barchart Disclosure Policy here.
More news from Barchart
- Citi Is Betting on a ‘Super Cycle’ in Airline Stocks. Here’s the Top-Rated Name to Buy Now.
- The Options Market Is Pricing in Huge Uncertainty for AST SpaceMobile (ASTS): Here’s How to Break the Deadlock
- How to Make a 1.1% Yield Shorting One-Month Microsoft Puts
- What’s Behind This Massive $100 Million Insider Buy on DoorDash Stock?


