Chesapeake, Virginia-based Dollar Tree, Inc. (DLTR) operates retail discount stores under the Dollar Tree and Dollar Tree Canada brands. With a market cap of $23.9 billion, the company sells an assortment of everyday general merchandise, including kitchen and dining, toys, books, crafts, cleaning, personal care, glasses, food carriers, gifts, and other household products.
Companies worth $10 billion or more are generally described as “large-cap stocks,” and DLTR perfectly fits that description, with its market cap exceeding this mark, underscoring its size, influence, and dominance within the discount stores industry. DLTR is performing well, driven by strong net sales and strategic decisions. The company's focus on its core brand and multi-price offerings attracts customers, and investments in tech and supply chain upgrades will enhance efficiency and customer experience, positioning Dollar Tree for long-term success.
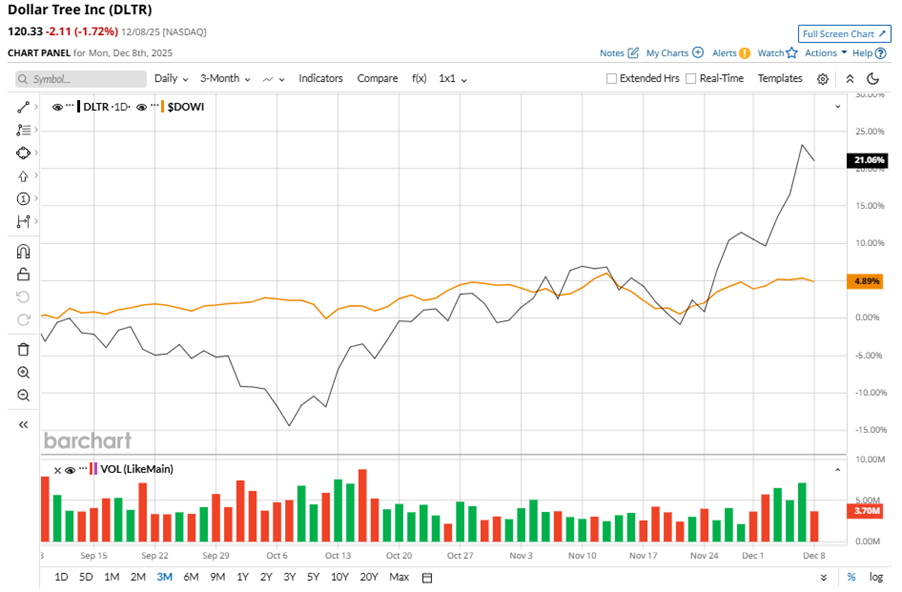
Despite its notable strength, DLTR slipped 4.3% from its 52-week high of $125.79, achieved on Dec. 5. Over the past three months, DLTR stock has gained 21.1%, outperforming the Dow Jones Industrials Average’s ($DOWI) 4.9% gains during the same time frame.
In the longer term, shares of DLTR rose 27.3% on a six-month basis and climbed 67.4% over the past 52 weeks, notably outperforming DOWI’s six-month gains of 11.6% and 6.9% returns over the last year.
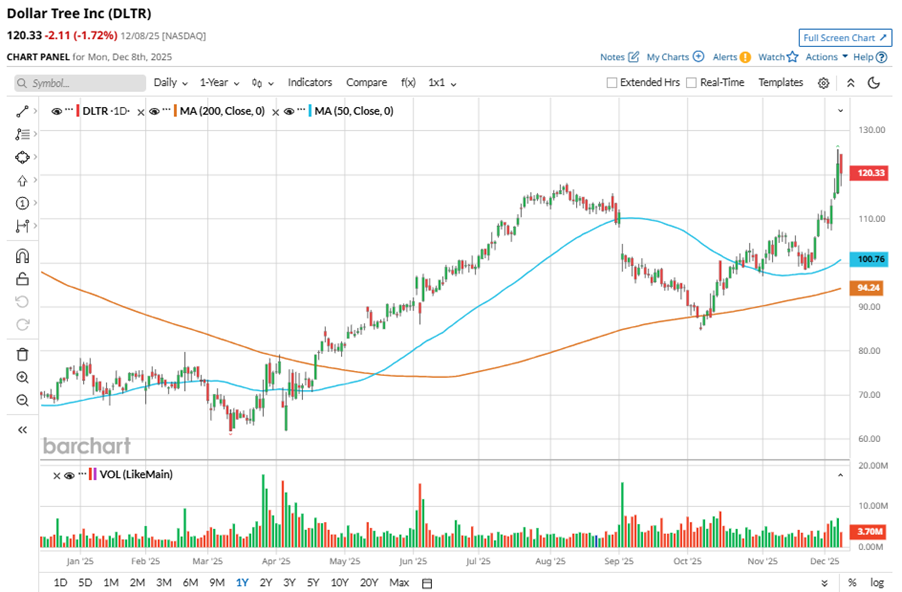
To confirm the bullish trend, DLTR has been trading above its 50-day moving average since late October. The stock has been trading above its 200-day moving average since mid-April, with a minor fluctuation.
DLTR’s strong performance is driven by its multi-price strategy, expanded discretionary assortment, and operational efficiency. The company's Halloween sales were strong, and its multi-price offering is boosting profitability, with each item sold delivering 3.5x more profit than fixed-price items. Dollar Tree's customer base is broadening as higher-income households spend more, and the company is focusing on increasing trip frequency among these new shoppers. With improved supply chain performance and cost management, DLTR expects continued seasonal strength and margin expansion.
On Dec. 3, DLTR shares closed up by 3.6% after reporting its Q3 results. Its revenue was $4.8 billion, exceeding analyst estimates of $4.7 billion. The company’s adjusted EPS of $1.21 beat analyst estimates by 11.8%.
In the competitive arena of discount stores, Dollar General Corporation (DG) has lagged behind DLTR, showing resilience with a 9.5% uptick on a six-month basis and 52.3% gains over the past 52 weeks.
Wall Street analysts are reasonably bullish on DLTR’s prospects. The stock has a consensus “Moderate Buy” rating from the 25 analysts covering it. While DLTR currently trades above its mean price target of $113.09, the Street-high price target of $140 suggests a 16.3% upside potential.
On the date of publication, Neha Panjwani did not have (either directly or indirectly) positions in any of the securities mentioned in this article. All information and data in this article is solely for informational purposes. For more information please view the Barchart Disclosure Policy here.
More news from Barchart
- Protect Your Babies and Your Portfolios with This ‘Strong Buy’ Stock
- Even If There Is an AI Bubble, Wall Street Says You Should Keep Buying This Magnificent 7 Stock
- Nvidia Just Gave Its CUDA Platform a Major Revamp. Will That Move the Needle for NVDA Stock?
- Dear Carvana Stock Fans, Mark Your Calendars for December 22