Valued at a market cap of $23.2 billion, Equity Residential (EQR) is a real estate investment trust (REIT) that owns, operates, and develops high-quality apartment communities in densely populated, high-income urban and suburban markets. The Chicago, Illinois-based company focuses on well-located properties near employment centers, transit, and lifestyle amenities, attracting long-term, professionally employed renters.
Companies worth $10 billion or more are typically classified as “large-cap stocks,” and EQR fits the label perfectly, with its market cap exceeding this threshold, underscoring its size, influence, and dominance within the REIT - residential industry. With a proven operating platform, disciplined capital allocation, and recurring rental income, the company remains one of the largest and most established multifamily REITs in the United States.
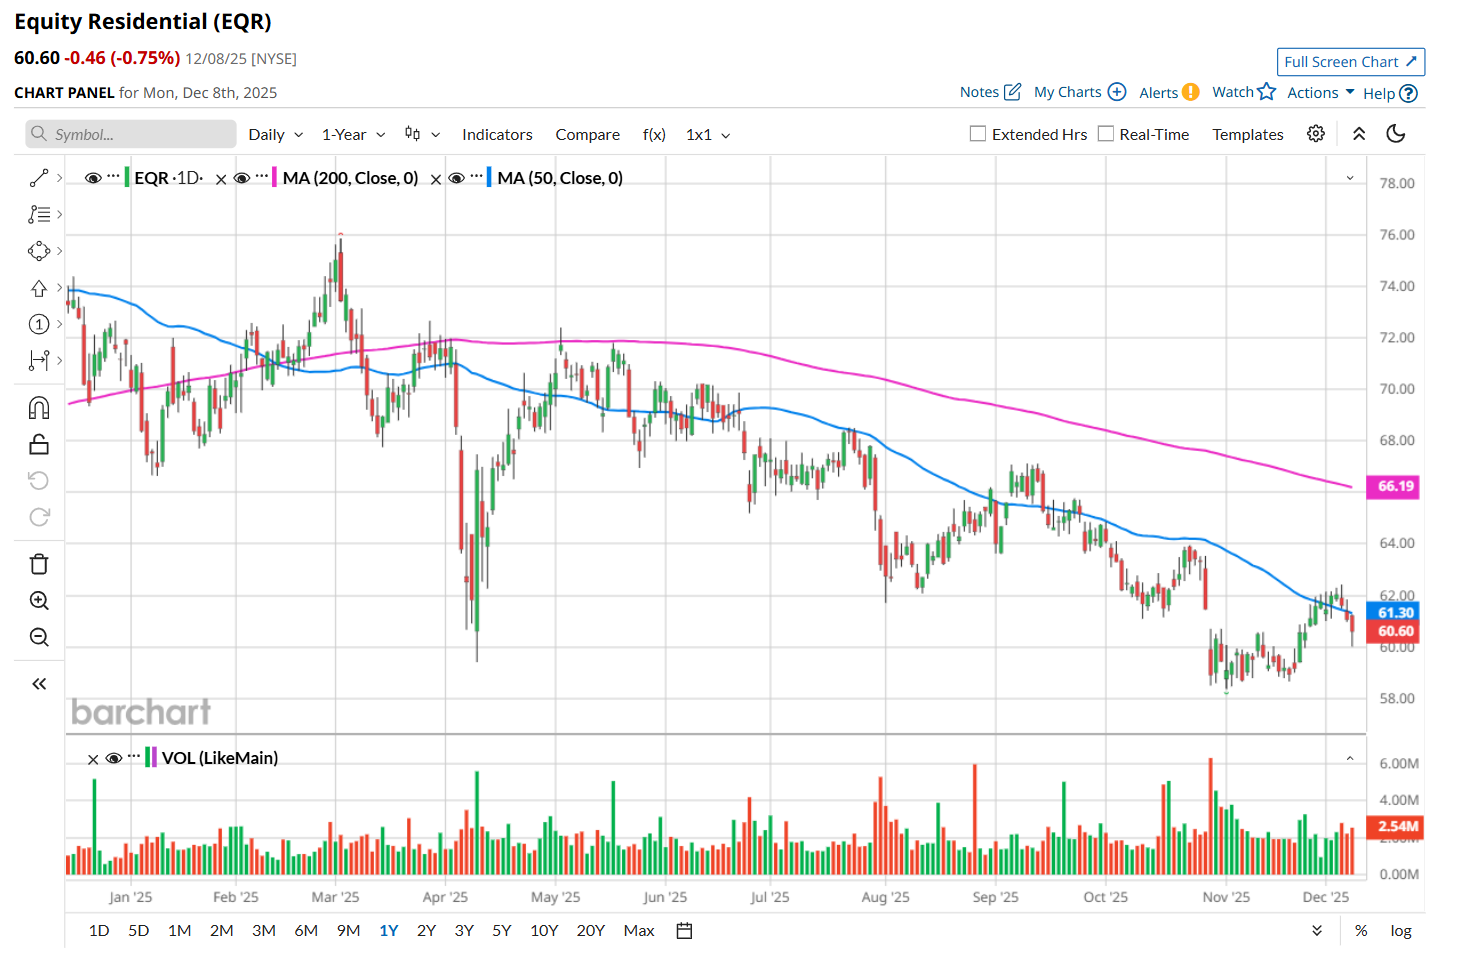
This residential REIT has dipped 20.1% below its 52-week high of $75.86, reached on Mar. 4. Shares of EQR have declined 8.7% over the past three months, underperforming the Nasdaq Composite’s ($NASX) 8% rise during the same time frame.
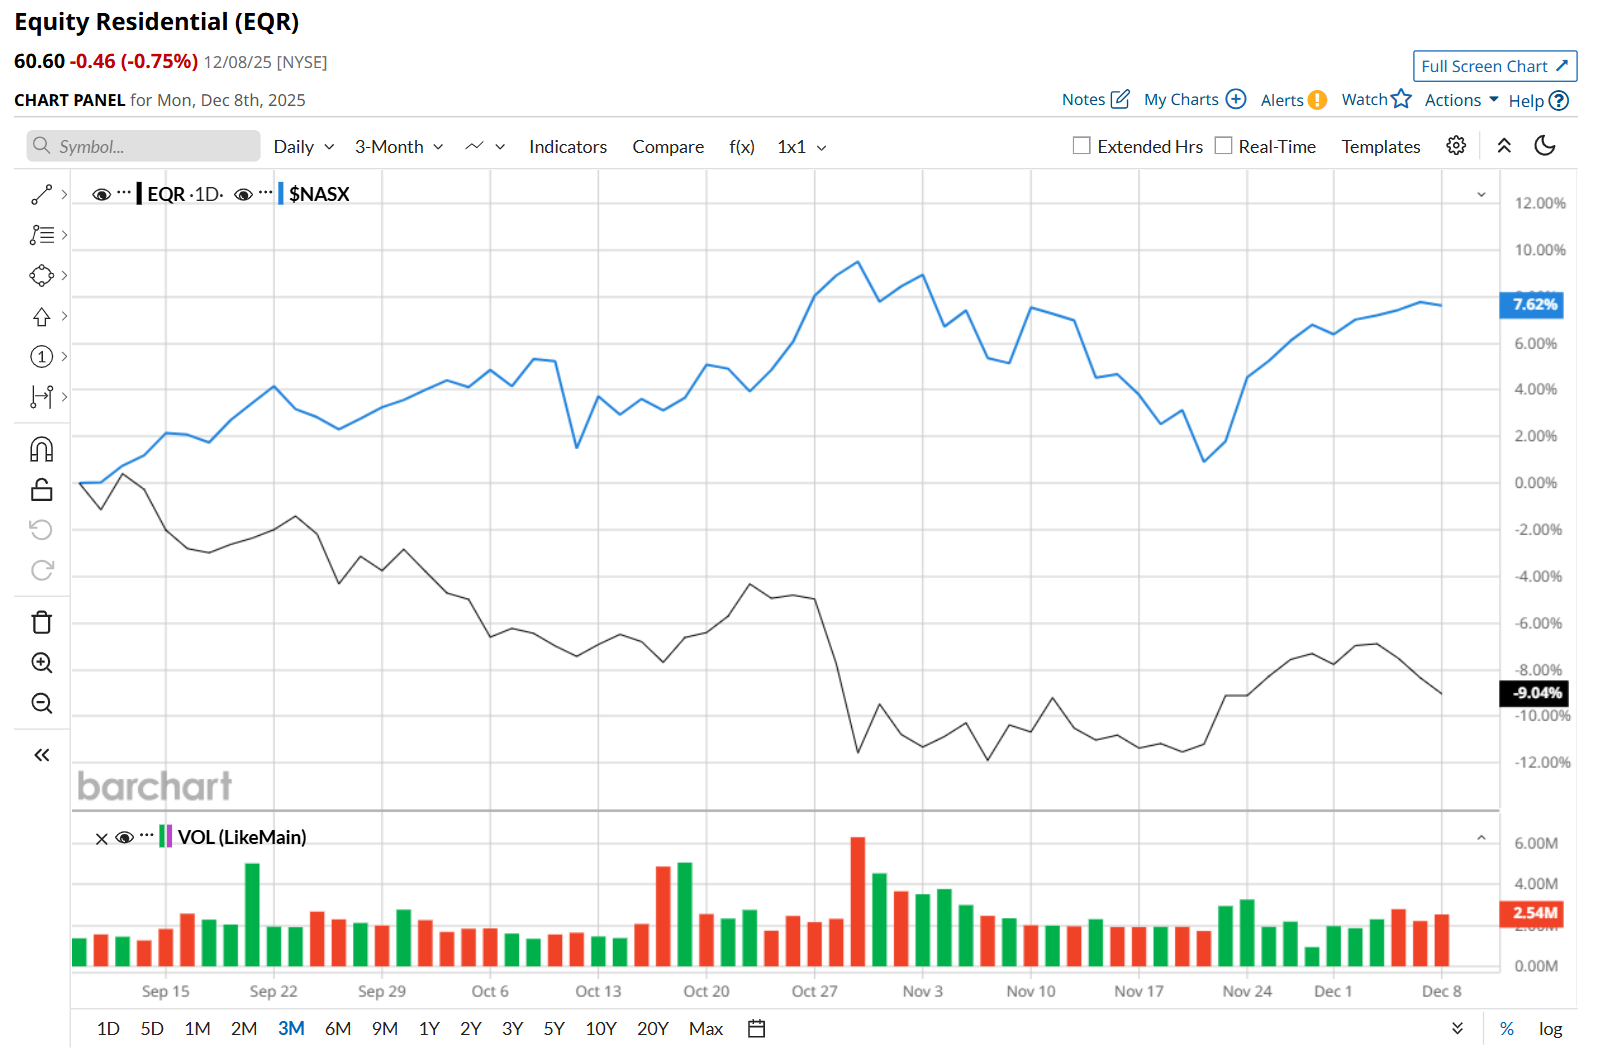
Moreover, on a YTD basis, shares of EQR are down 15.6%, compared to NASX’s 21.9% return. In the longer term, EQR has fallen 17.8% over the past 52 weeks, considerably lagging behind NASX’s 18.6% uptick over the same time frame.
To confirm its bearish trend, EQR has been trading below its 200-day moving average since early March and has remained below its 50-day moving average since mid-June, with slight fluctuations.
On Oct. 28, EQR delivered its Q3 results, and its shares plunged 4.2% in the following trading session. The company’s overall revenue increased 4.6% year-over-year to $782.4 million, beating consensus estimates by a slight margin. Meanwhile, its normalized funds from operations (NFFO) per share increased 4.1% from the year-ago quarter to $1.02 and met Wall Street’s expectations. However, the company lowered its fiscal 2025 revenue, net operating income, EPS, and FFO guidance, which might have weighed on investor sentiment. Management attributed the reduced outlook to softer leasing demand in late Q3, particularly in Washington, D.C., as well as delays in implementing certain income-generating initiatives.
EQR has outpaced its rival, AvalonBay Communities, Inc. (AVB), which declined 21.6% over the past 52 weeks and 19.3% on a YTD basis.
Despite EQR’s recent underperformance, analysts remain moderately optimistic about its prospects. The stock has a consensus rating of "Moderate Buy” from the 26 analysts covering it, and the mean price target of $69.87 suggests a 15.3% premium to its current price levels.
On the date of publication, Neharika Jain did not have (either directly or indirectly) positions in any of the securities mentioned in this article. All information and data in this article is solely for informational purposes. For more information please view the Barchart Disclosure Policy here.
More news from Barchart
- Even If There Is an AI Bubble, Wall Street Says You Should Keep Buying This Magnificent 7 Stock
- Nvidia Just Gave Its CUDA Platform a Major Revamp. Will That Move the Needle for NVDA Stock?
- Dear Carvana Stock Fans, Mark Your Calendars for December 22
- After a Red-Hot Rally on S&P 500 Inclusion, Carvana Stock Needs a ‘Cool’ Option Collar. How to Trade CVNA Here.