With a market cap of $23.3 billion, NetApp, Inc. (NTAP) is a global provider of enterprise software, systems, and services that help organizations modernize and manage their data infrastructures across on-premises, hybrid, and public cloud environments. The company operates through its Hybrid Cloud and Public Cloud segments, offering advanced data management software, high-performance storage solutions, and cloud-integrated services.
Companies valued at $10 billion or more are generally considered “large-cap” stocks, and NetApp fits this criterion perfectly. Serving a wide range of industries, NetApp delivers comprehensive operational, professional, and support services to enhance data efficiency, security, and performance worldwide.
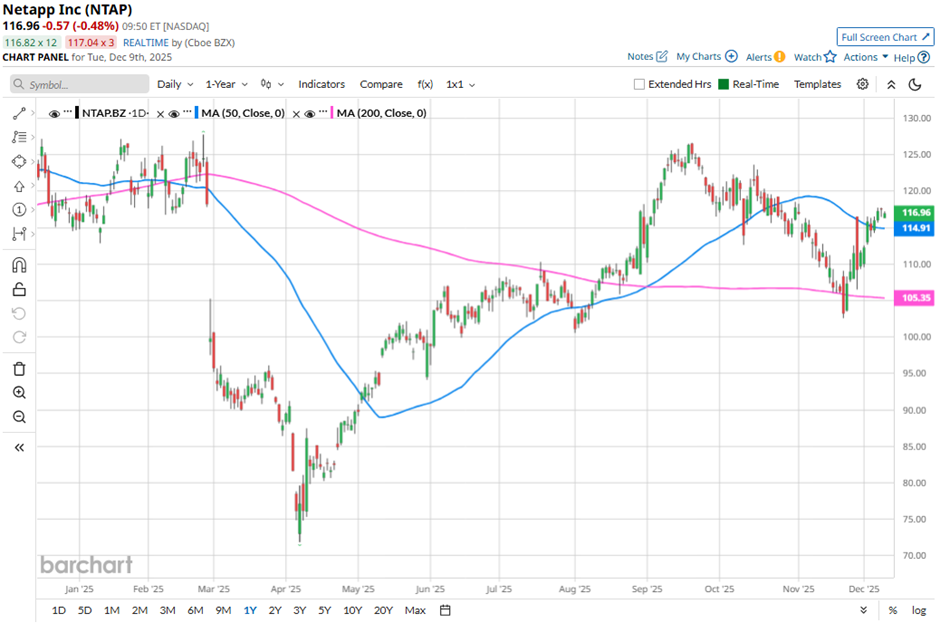
Shares of the data storage company have fallen 9.2% from its 52-week high of $131. Shares of NetApp have declined 5.2% over the past three months, underperforming the broader S&P 500 Index’s ($SPX) 5.4% gain over the same time frame.
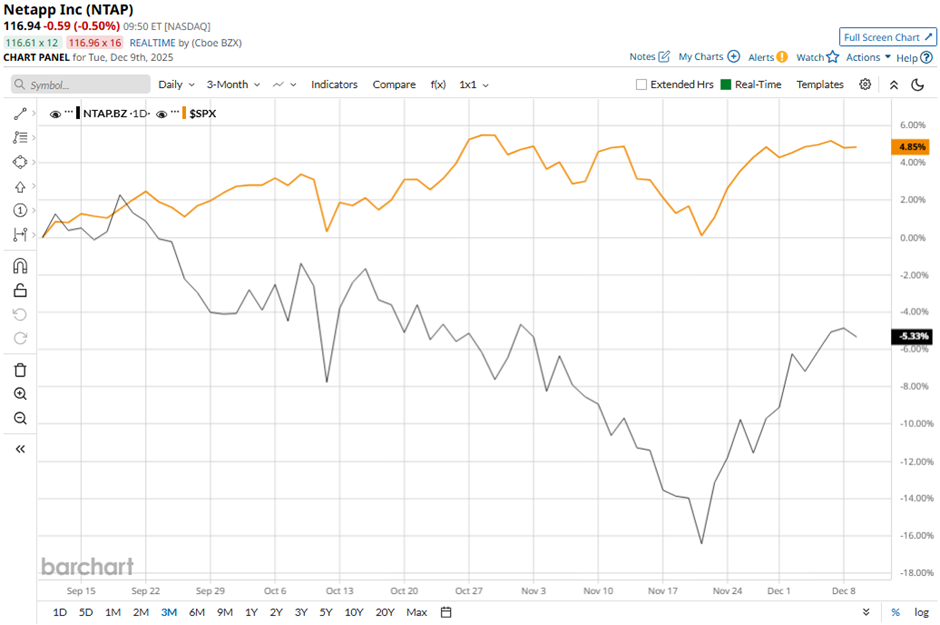
Longer term, NTAP stock is up marginally on a YTD basis, lagging behind SPX's 16.4% increase. Shares of the San Jose, California-based company have decreased 8.5% over the past 52 weeks, compared to the 12.4% return of the SPX over the same time frame.
Yet, the stock has been trading above its 200-day moving average since early August.
NetApp delivered strong fiscal Q2 2026 results on Nov. 25, with net revenues of $1.71 billion, up 3% year-over-year and record adjusted EPS of $2.05, well above analysts’ expectations. Investors also reacted positively to robust business momentum, including 9% year-over-year all-flash array revenue growth to $1 billion, 32% growth in first-party and marketplace cloud storage services, and record operating margins. However, the stock fell 2% the next day.
In comparison, rival Western Digital Corporation (WDC) has significantly outperformed NTAP stock. Shares of Western Digital have soared around 217% over the past 52 weeks and 276% on a YTD basis.
Despite NTAP’s weak performance, analysts remain moderately optimistic about its prospects. Among the 20 analysts covering the stock, there is a consensus rating of “Moderate Buy,” and the mean price target of $124.47 suggests a premium of 6.4% to its current levels.
On the date of publication, Sohini Mondal did not have (either directly or indirectly) positions in any of the securities mentioned in this article. All information and data in this article is solely for informational purposes. For more information please view the Barchart Disclosure Policy here.
More news from Barchart
- Down 8% in December, Investors Should Wait Until Late January to Buy Harley-Davidson
- Protect Your Babies and Your Portfolios with This ‘Strong Buy’ Stock
- Even If There Is an AI Bubble, Wall Street Says You Should Keep Buying This Magnificent 7 Stock
- Nvidia Just Gave Its CUDA Platform a Major Revamp. Will That Move the Needle for NVDA Stock?