Baltimore, Maryland-based T. Rowe Price Group, Inc. (TROW) operates as an asset manager, managing equity and fixed income mutual funds. With a market cap of $23.3 billion, the company has a vast customer base of individuals, institutional investors, retirement plans, and financial intermediaries.
Companies worth $10 billion or more are generally described as “large-cap stocks.” T. Rowe fits this bill perfectly. Given the company’s strong presence and influence in the asset management industry, its valuation above this mark is unsurprising.
The asset management giant touched its 52-week high of $125.04 on Dec. 9, 2024, and is currently trading 16.4% below that peak. Meanwhile, TROW stock prices have declined 3.4% over the past three months, compared to the Nasdaq Composite’s ($NASX) 8% gains during the same time frame.
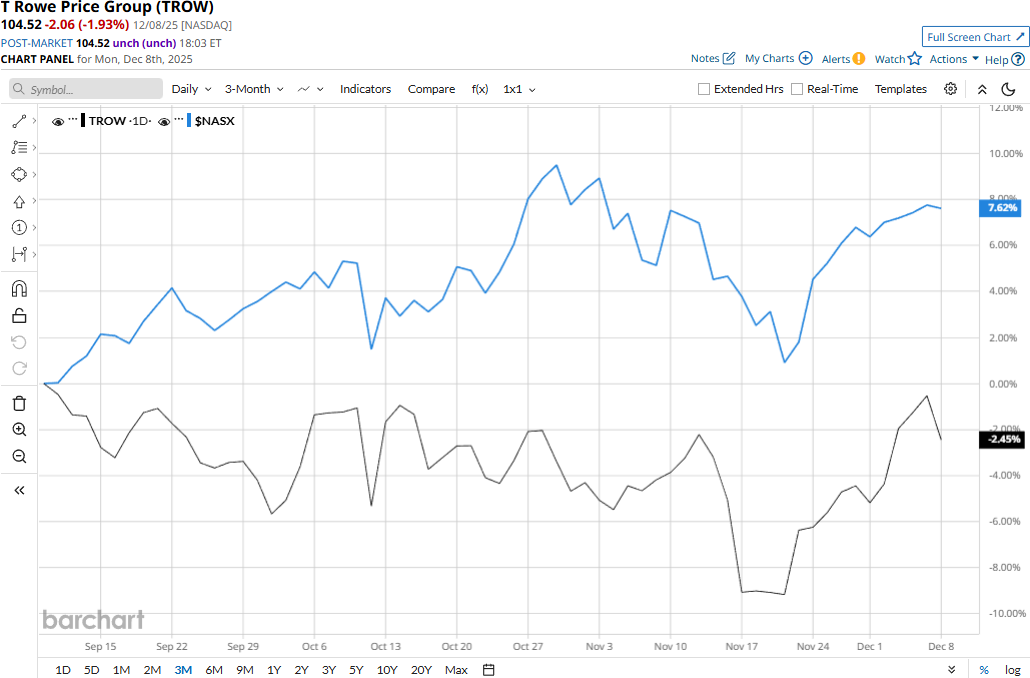
T. Rowe’s performance has remained grim over the longer term as well. TROW stock prices have declined 7.6% on a YTD basis and 15.6% over the past 52 weeks, compared to the Nasdaq’s 21.9% surge in 2025 and 18.6% gains over the past year.
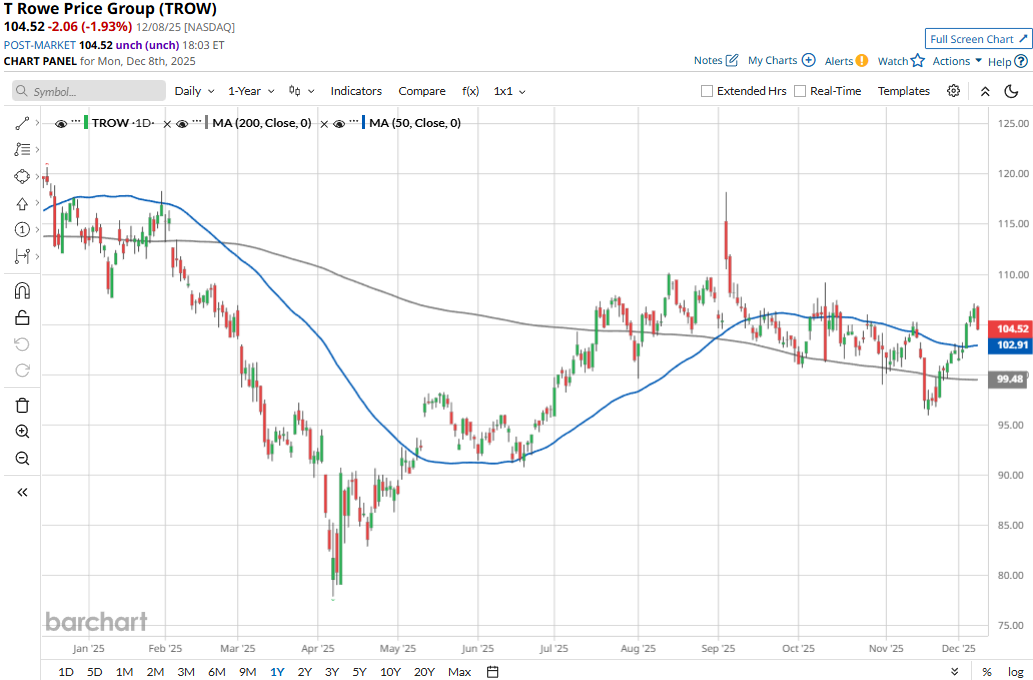
TROW stock has traded below its 50-day moving average since September, with some fluctuations, and along its downward-sloping 200-day moving average since July, underscoring its bearish trend.
T. Rowe Price Group’s stock prices observed a marginal uptick in the trading session following the release of its better-than-expected Q3 results on Oct. 31. The company has continued to observe notable increases in advisory fees across asset classes. This led to its overall net revenues growing 6% year-over-year to $1.9 billion, exceeding the Street’s expectations by 2.3%. Further, its adjusted EPS grew 9.3% year-over-year to $2.81, beating the consensus estimates by 10.2%. However, on a concerning note, the company registered $7.9 billion in net client outflows during the quarter.
Meanwhile, T. Rowe has notably underperformed its peer, State Street Corporation’s (STT) 26.4% surge in 2025 and 26.1% returns over the past year.
Among the 14 analysts covering the TROW stock, the consensus rating is a “Hold.” As of writing, the stock is trading slightly below its mean price target of $107.69.
On the date of publication, Aditya Sarawgi did not have (either directly or indirectly) positions in any of the securities mentioned in this article. All information and data in this article is solely for informational purposes. For more information please view the Barchart Disclosure Policy here.
More news from Barchart
- These 2 High-Yield Dividend Stocks Are Some of the Safest Buys Right Now
- A Low-Cost Model 3 Just Hit the Streets in Europe. Can That Help Turn Tesla Stock Around?
- Is It Too Late to Chase the IBM-Driven Rally in Confluent Stock?
- Here Is Where Option Traders Expect Carvana Stock to Be When It Joins the S&P 500 Index