Xylem Inc. (XYL) is a leading global water-technology company that designs, manufactures, and services engineered products and solutions for public utilities, industrial, residential, commercial, and agricultural clients worldwide. Headquartered in Washington, District of Columbia, the company operates through key segments such as Water Infrastructure; Applied Water; Measurement & Control Solutions; and Water Solutions & Services. It has a market cap of $33.7 billion.
Companies worth $10 billion or more are generally described as “large-cap stocks,” and Xylem perfectly fits that description, with its market cap exceeding this mark, underscoring its size, influence, and dominance within the specialty industrial machinery industry. Xylem cements its leadership in water technology, driven by its sterling brand reputation and customer trust.
XYL slipped 10.3% from its 52-week high of $154.27, achieved on Oct. 30. Over the past three months, XYL stock has declined 1.2%, underperforming the S&P 500 Index’s ($SPX) 5.4% gains during the same time frame.
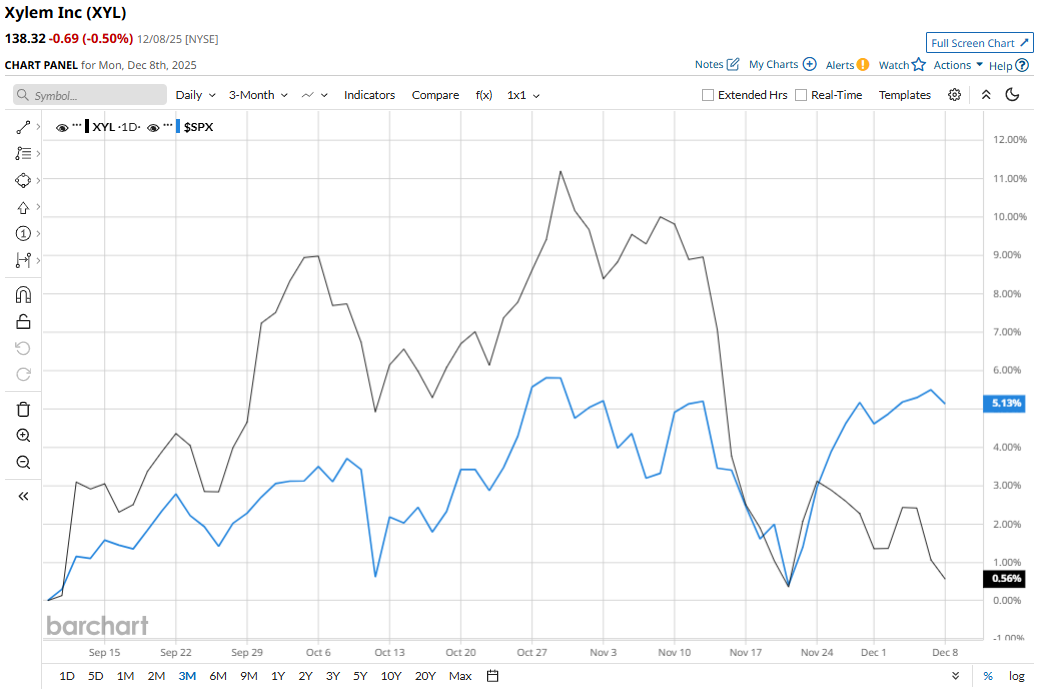
In the longer term, shares rose 19.2% on a YTD basis, outperforming SPX’s YTD gains of 16.4%. However, XYL climbed 9.5% over the past 52 weeks, underperforming SPX’s 12.4% returns over the same time frame.
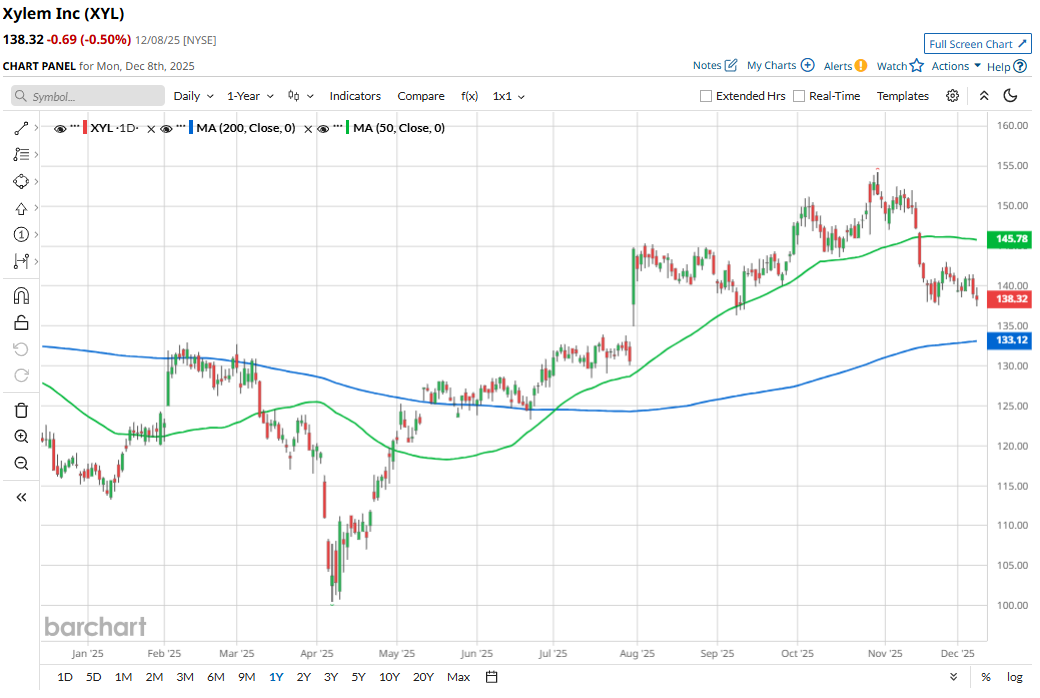
XYL has largely been trading above its 200-day moving average since mid-May. It has also been trading above the 50-day moving average since late April, but has dropped below the line since mid-November.
The stock rose in 2025 due to stable financial results, driven by demand for its water management solutions, successful pricing/productivity gains, and strategic investments. In the most recent quarter (Q3 2025), the company reported revenue of $2.3 billion, up 8%, while adjusted EPS came in at $1.37, which is a 23% increase over the prior-year quarter.
In the competitive arena, Parker-Hannifin Corporation (PH) has taken the lead over XYL, with 38.3% returns YTD and 26.4% gains over the past year.
The stock has a consensus “Moderate Buy” rating from the 21 analysts covering it, and the mean price target of $170.62 suggests a potential upside of 23.4% from current price levels.
On the date of publication, Subhasree Kar did not have (either directly or indirectly) positions in any of the securities mentioned in this article. All information and data in this article is solely for informational purposes. For more information please view the Barchart Disclosure Policy here.
More news from Barchart
- Protect Your Babies and Your Portfolios with This ‘Strong Buy’ Stock
- Even If There Is an AI Bubble, Wall Street Says You Should Keep Buying This Magnificent 7 Stock
- Nvidia Just Gave Its CUDA Platform a Major Revamp. Will That Move the Needle for NVDA Stock?
- Dear Carvana Stock Fans, Mark Your Calendars for December 22


